Research - African Journal of Food Science and Technology ( 2024) Volume 15, Issue 2
Received: 14-Feb-2024, Manuscript No. AJFST-24-127611; , Pre QC No. AJFST-24-127611; , QC No. AJFST-24-127611; , Manuscript No. AJFST-24-127611; Published: 12-Mar-2024
Central Composite Design (CCD) of response surface methodology (RSM) was adopted to determine the effect of the wheat flour, OFSP (Mother,s Delight (MD) and King J (KJ)) and pigeon pea on the quality characteristics of pasta product. CCD consisting of three variables (wheat flours (A), 0-65%, OFSP (B), 0-20% and pigeon pea (C), 0-15%). The study optimized the formulation ingredients by maximizing responses of interest and minimizing responses of least importance. For optimization, protein, ash, beta-carotene, were maximized while pytate, cooking loss and trypsin inhibitors were minimized. Crude protein, crude ash, beta-carotene, phytate, trypsin inhibitors and cooking loss were in the range of 9.63-11.38%, 0.86-1.71%, 0.13-0.21mg/100g, 1.13-1.26 mg/100g, 6.27-10.94 mg/100g and 2-6.75% respectively for optimization of MD flour blends. Crude protein, crude ash, beta-carotene, phytate, trypsin inhibitors and cooking loss were in the range of 9.63-11.43%, 1.02-2.01%, 0.07-0.12mg/100g, 1.11-1.80 mg/100g, 8.08-10.66 mg/100g and 3.5-7.90% respectively for optimization of KJ flour blends. The optimum blend for MD flour was wheat flour (608.63 g), OFSP (241.85 g), Pigeon pea (149.53 g) while optimum blend for KJ flour was wheat flour (649.70 g), OFSP (180.89 g), Pigeon pea (169.40 g). For cooking time, rehydration and cooking loss for control and optimized sample (MD and KJ) ranges were 14-17mins, 7.2-11.60% and 6.63- 14% respectively. Sensory evaluation revealed that pigeon pea and OFSP could be incorporated into pasta with no significant difference.
Pasta, Orange Fleshed Sweet Potato, Pigeon Pea.
Pasta is a widely consumed food in all over the world; it has a universal appeal and could be a good carrier for supplying needed nutrients to its consumers. The consumption of pasta has increased over the years due to easy availability, less cooking time and better sensory attributes (Carini et al. 2014). Coarse semolina obtained from durum wheat and water is the main ingredients of conventional pasta products. The major food crop used in production of conventional pasta is wheat which has a limited nutritional profile and is lacking in some essential amino acids, lysine, threonine and vitamin A (Zhao et al. 2005). Supplementing wheat flour with locally produced foods such as orange fleshed sweet potatoes and pigeon pea for production of widely consumed food like pasta will improve its nutritional status, ensure food security, combat malnutrition problems, enhanced health, increase farming and economic activities in Nigeria. Orange Fleshed Sweet Potatoes (OFSP) is one of the newly bio fortified crops that is very high in pro vitamin A. It is a good source of thiamine, riboflavin, niacin, ascorbic acid, essential minerals such as zinc, phosphorus, magnesium, potassium and iron and many other functional compounds (Preedy et al. 2011). Pigeon pea (Cajanus Cajan) is a legume plant that is locally available, affordable and under-utilized grain of the tropics and sub-tropics (Akingbade et al., 2017).
The aim of this research therefore was to evaluate the sensory attributes of pasta from wheat flour enriched with OFSP and pigeon pea.
Experimental design
Response Surface Methodology was used to study the combined effect of formulation ingredients necessary in the production of pasta from wheat, pigeon pea and OFSP. The ranges for the best formulations from the literature were selected as the bases for this study. The desirable ranges (upper and lower limits) of the independent variables selected for this study were 0- 65% for wheat flour (A), 0-20% for OFSP flour(B) and 0-15% for pigeon pea flour (C). The experimental design used was the Central Composite Rotatable Design (CCRD). The composition of the composite flour blends has the form: A (Wheat flour) + B (OFSP flour) + C (Pigeon Pea flour) totaling to 100%. This equation means mathematical linear dependence of the variables if the amounts of the ingredients are used directly as variables (A+B+C=100%). From the equation, the quantities of any ingredient could be determined by the amount of the two other ingredients. To function in a multiple factor analysis, these ingredients may be transformed to ratio, which can be varied independently (Singh et al. 2003). For this study, the following ingredients ratios were selected as x1 variable.
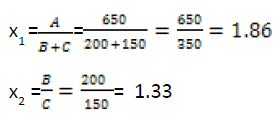
The centre point for the design was selected with ingredients at levels expected to yeild, at least satisfactory experimental results. With the centre composition selected, the normal x1 ratio was calculated by using the normal weight composition of the formulation given in Table 1. The design depended upon the symmetrical selection of variation increments about the centre composition. These levels of variation were chosen to be within the range of reasonable formulation, and the increments were carefully selected, as interpretation of the result will be valid only within the experimental limits. The levels selected were based on previous similar studies. The increments of variation for each variable space around the centre point ratios, along with the equations relating the actual and coded ratios are presented in (Table 1). By substituting these equations, compositions were coded for solution of the multiple regression equation.
| Variable | Increment | Xi coded | Levels | |||
|---|---|---|---|---|---|---|
| -2 | -1 | 0 | 1 | 2 | ||
| x1 | ± 0.25 | 1.36 | 1.61 | 1.86 | 2.11 | 2.36 |
| x2 | ± 0.20 | 0.93 | 1.13 | 1.33 | 1.53 | 1.73 |
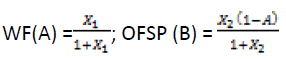
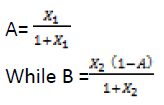
The coded level Xi ratios for each treatment as per experimental design was translated into working quantities of ingredients. The value for pasta ingredients were obtained by systematic algebraic solutions for A, B, and C in terms of actual Xi ratios and a unit quantity of product. The equations used to convert to real values were as given below:
C= 1000-(A+B)
The values for pigeon pea that were dependent were obtained from the difference from 1000; the sum of WF and OFSP. The resulting weights of the ingredients in different treatments were given in (Table 2).
| Run | Treatment Coded level | Weight of ingredients(g) | |||
|---|---|---|---|---|---|
| X1 X2 WF(A) | OFSP(B) | Pigeon pea (c) | |||
| 1 1 | -1 | 678.46 | 170.83 | 150.71 | |
| 2 1 | 1 | 678.46 | 194.73 | 126.81 | |
| 3 | -1 | -1 | 616.86 | 203.24 | 179.90 |
| 4 | -1 | 1 | 616.86 | 231.68 | 151.46 |
| 5 | 2 | 0 | 702.38 | 169.87 | 127.75 |
| 6 | -2 | 0 | 576.27 | 241.85 | 181.88 |
| 7 | 0 | -2 | 650.35 | 168.51 | 181.14 |
| 8 | 0 | 2 | 650.35 | 221.60 | 128.05 |
| 9 | 0 | 0 | 650.35 | 199.61 | 150.04 |
| 10 | 0 | 0 | 650.35 | 199.61 | 150.04 |
| 11 | 0 | 0 | 650.35 | 199.61 | 150.04 |
| 12 | 0 | 0 | 650.35 | 199.61 | 150.04 |
| 13 | 0 | 0 | 650.35 | 199.61 | 150.04 |
A total of thirteen experimental runs (Table 2) were generated by Design Expert Software (version 7.0.7). Theoretical model equation is shown in below equation.
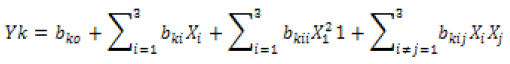
Where: Yk is the predicted responses (i.e. protein, phytate, trypsin inhibitors, beta-carotene and cooking loss), bko is the value of fitted response constant at the centre point of the design, i.e point (0, 0), while bki, bkii, and bkij are the linear, quadratic and cross product regression coefficient, respectively and Xi (i = 1, 2,…) are the coded independent variables of X1, X2, and X3 (Singh et al. 2003)
Sample Preparation
OFSP was processed into flour as described by Onabanjo and Ighere (2014) with some modification. The OFSP roots were sorted, cleaned with water to remove soils, peeled, and rewashed. The peeled roots were cut into 1mm thickness with a slicer inside cold tap water. The chips were drained, dried at 60°C for 12h, milled, seived through 250µm seive, packaged in polypropylene bag and stored in freezer until further analysis.
The method described by Fasoyiro et al. (2010) was modified for the production of pigeon pea flour. Pigeon pea seeds were cleaned, sorted and soaked in water for 10h and drained. The seed coats were dehulled manually to separate the seed coats from the cotyledon before draining, and drying in the cabinet dryer at 60°C for 10 h. The dried pigeon pea seeds were allowed to cool at room temperature, milled with hammer milling machine, sieved with sieve 250µm and packaged in polypropylene bag and stored at room temperature until further analysis.
The flour of wheat, OFSP and Pigeon pea were added together to form composite flour blends based on the ratio determined by RSM formulation in Table 2. Thirteen experimental runs of the composite flour blends were analyzed for the following responses: protein, phytate, ash, trypsin inhibitors, beta-carotene and cooking loss and the results were used for the optimization. The composite formulations were also used to produce pasta.
Production of Pasta (Macaroni)
Pasta was produced according to the method described by Omeire et al. (2014). Composite flour was weighed in required amounts and mixed well. Flour was mixed with warm water at 40°C; the mixture was thoroughly mixed to form dough. The formed dough was allowed to rest for 20 min, then kneaded and rolled with rolling pin to form sheets. The sheets were extruded using a cold extruder. The pasta strands were put in aluminum trays and oven dried at 60°C for 2 hrs. The resultant dried products of various blends were packed in high density polyethylene (HDPE) bags for subsequent analysis.
Crude Protein Determination
The crude proteins in the samples were determined by the routine semi-micro Kjeldahl procedure (AOAC, 2000). Approximately 1g of the sample was placed in digestion flask. This was followed by the addition of 5g Kjedahl catalyst and 200 ml concentrated H2SO4 respectively. Another flask containing no sample was similarly treated to serve as a blank. The flasks were placed in inclined position and heated gently until frothing ceased; boiling was continue until solution attained clarity. The flask was allowed to cool and 60 ml distilled water was cautiously added. The flask was immediately connected to digestion bulb on condenser, ensuring that the tip of the condenser was immersed in solution of standard acid and 5-7 drops of mixed indicator in the receiver. The flask was rotated to mix content thoroughly; and heated until all NH3 is distilled. The receiver was removed and the content titrated with standard NaOH solution.
Calculation:

A = Volume (ml) of 0.2 N HCl used sample titration;
B = Volume (ml) of 0.2N HCl used in blank;
N, = Normality of HCl;
W = Weight (g) of sample.
Determination of total ash content: This was done by the furnaces incineration gravimetric method described by AOAC, 2000. 5g of the processed sample was measured into a previously weighed porcelain crucible. The sample was burnt to ashes in a muffle furnace at 550°C. When it has become completely burnt, it was cooled in desiccator and weighed. The weight of ash obtained was determined by difference and calculated as a percentage of the weight of sample analyzed thus:
Determination of Phytate
Phytate was determined as phytate phosphorus by the modification of Fruhbeck et al., (1995). Four grams of composite flour sample was soaked in 100 ml of 2% HCl for 3 h and then filtered. 25 ml of the filtrate was placed in a 100 ml conical flask and 5 ml of 0.03% NH4SCN was added as indicator. This was titrated with ferric chloride solution which contained about 0.005 mg of Fe per ml of FeCl3, equivalent was obtained and from this, the phytate content in mg/100g was calculated.
Iron equivalent = TV× 1.95 (3.12)
Phytic acid = TV × 1.95 ×1.19 × 3.5 (3.13)
%Phytic acid = TV ×8.24 ×100 × Weight of sample (3.14)
Where TV = Titre value
Determination of trypsin inhibitors activity
The trypsin inhibitor activity of the flour sample was determined by the method of Kakade et al. (1977) using casein as substrate. The sample flour was defatted with petroleum ether and methanol in the ratio 1:2. One gram of the defected sample was suspended in 19 ml distilled water and the pH of the suspension was adjusted to 7.6 with a pH meter (an Orion Model 720A). After mechanical shaking for 1 h, the suspension was diluted to 50 ml with phosphate buffer. One milliliter of the inhibitor extract was pipetted into a triplicate set of the test tubes, 1 ml of the trypsin solution was added to each tube, and the tube was placed in the water bath at 37°C. Two mililiter of the casein solution previously warmed to 37°C for exactly 20 min at which time the reaction was stopped by adding 6 ml of 5% tricholoroacetic acid to the tubes. After standing for 1h at room temperature, the suspension was filtered, and the absorbance of the filtrate was measured at 280 nm with digital spectrophotometer (spectronic 601 models, Milton Roy Company, USA). The blank contained 6 ml of 5% TCA and 4 ml buffer. Trypsin inhibitor activity was obtained by dividing the absorbance by 0.01
Trypsin inhibitor (TIU/mg) = Absorbance reading/ 0.01 (3.16)
Determination of β carotene
The total carotenoid content was determined using a UV/Visible spectrophotometer according to Chan and Cavaletto (1982). Six grams (6 g) of the material was combined with 5 g of hyflosupercel (a filtration aid) and 15 ml of 70 percent methanol (v/v) in a Buchner funnel with filter paper. The residue was extracted two more times using 15 ml acetone: petroleum ether 1:1. The extracts were then transferred to a separating funnel with a capacity of 500 ml. The mixture was allowed to stand for 1.5 h after adding 5% of 10% KOH in methanol (v/v). Partitioning was done by gently mixing 15 ml petroleum ether and 20 ml 20% NaCl (w/v) together and the bottom (hypophasic) layer were discarded. To remove excess acetone, the epiphasic (upper) layer was rinsed three times with 20 ml distilled water, and then filtered through a tiny funnel containing 3 g anhydrous sodium sulfate. To keep sodium sulfate in the funnel, a glass stopper was used. The absorbance was measured at 450 nm, the wavelength of maximal absorption for beta-carotene in petroleum ether, and the filtrate was made up to 100 ml with petroleum ether.
Cooking Loss (CL)
Cooking loss was determined by modifying AACC approved method (AACC, 2010). Three hundred milliliters of distilled water were brought to a rolling boil in a 750 ml saucepan. To avoid contributing to cooking water residue, no salt was added to the cooking water; twenty grams of dried pasta were added and cooked, stirring occasionally. The cooked pasta was drained into a large saucepan and washed with distilled water for 5 seconds. The cooking water was poured into a 400 mL beaker that had been pre-weighed and covered with perforated plastic wrap. The beakers were placed on a baking sheet and were dried in a conventional oven heated by pilot light for three days. The oven was set at a temperature of 52-60°C. The beakers were withdrawn from the oven, cooled in a desiccator, and re-weighed once all of the cooking water had evaporated and a consistent weight had been achieved. The difference in weight of the beaker was used to calculate the residue, which is given as a percentage of the original weight. Each pasta mixture was tested in two different ways.
Cooking time
The cooking time of the pasta was measured by cooking 5 g noodles (2-3 cm long) in 200 ml distilled water. Every 30 seconds, the noodle strands were removed and pressed between two pieces of watch glass. Optimum cooking time was achieved when the center of the noodles was fully hydrated (Tan et al., 2009). All subsequent analyses were conducted on the cooked pasta for the optimal cooking time.
Percentage of Rehydration (RE)
Percentage of Rehydration (RE) was determined by the method of Hormdok et al. (2007). The RE was calculated as the percentage increase in weight of the cooked noodle compared to the weight of dried noodle.
Sensory evaluation
Preference test
The sensory attributes of the product were evaluated by untrained 50 panelists from the Department of Food Science, LAUTECH Ogbomoso. The age of the panelists ranged from 20 years to 40 years for both male and female. All samples were evaluated using 9-points Hedonic scale, where 1 was coded dislike very much and 7 was coded like very much. Each of the samples was served and presented in a plate with a random set of 3 coded digit numbers. The panelists were given drinking water to rinse their mouth before evaluation. The attributes evaluated were appearance, taste, fimness, colour and overall acceptability.
Descriptive test
Descriptive test was also done by 30 untrained panelists from the Department of Food Science, LAUTECH Ogbomoso, their age ranged from 40 to 50 years, both male and female. Each product sample was served and presented in a plate with a random set of 3 coded digit numbers. The panelists were given drinking water to rinse their mouth before evaluation. The attributes evaluated were colour, firmness and stickness and the questionnaire for discriptive test is in Appendix B.
Statistical analysis
All treatments were replicated twice for reproducibility and analysis done in duplicate. The statistic al analysis of the data was done with Statistical Analysis Systems (SAS, 1999) package (Version 8.2 SAS Institute Inc.). Statistically significant differences (p< 0.05) in all data were determined by analysis of variance procedure while least significant difference was used to separate the means.
Results and Discussion
Description of the design summary of the semolina, pigeon pea and OFSP
The design generated thirteen (13) experimental runs and the result obtained showed that no transformation was done for the seven responses considered. 2 Factorial models was generated for all the responses i.e. crude protein and trypsin inhibitor beta-carotene, phytate and cooking loss. Thirteen experimental runs and the result were generated for the two species of orange fleshed sweetpotato (OFSP) i.e. Mother’s Delight (MD) and King J (KJ).
The model equations for all the responses for MD are described in Equation. 4.1 to 4.6.
Protein = 10.64-0.674A-0.67B+C-0.94AB+1.26AC+0.15BC
Ash= 1-0.15A-0.095B+C-0.227AB+0.04AC+1.33BC
Phytate = 1.21-0.04A-0.06B+C+0.02AB+0.0042AC+0.064BC
Trypsin inhibitors=7.10+0.54A+0.767B+C-8.80AB-10.31AC-16.12BC
Beta-carotene = 0.17+0.02A+0.03B+C+0.008AB-0.03AC+0.0019BC
Cooking Loss= 4.64-2.72A-2.95B+C+7.25AB-2.87AC+3.78BC
Key
A = Wheat flour
B = Orange fleshed sweetpotato (MD)
C = Pigeon pea
The model equations for all the responses for KJ are described in Equation.
Protein=10.29+0.4046A+0.3797B+C-0.8539AB-1.67AC-1.47BC
Ash=1.58-0.2441A-0.3442B+C+0.9971AB+0.8387AC+0.7447BC
Beta-carotene=0.0907-0.0481A-0.0209B+C+0.0727AB-0.0443AC+0.0093BC
Phytate=1.21+0.0236A+0.02459B+C+0.2106AB-0.1275AC+0.1575BC
Trypsin inhibitors=9.31-0.4592A+0.0760B+C+0.4787AB-2.87AC-1.38BC
Cooking Loss=5.92+0.961A+1.96B+C-0.8672AB+2.09AC-0.4575BC
Key
A = Wheat flour
B = Orange fleshed sweetpotato (King J)
C = Pigeon pea (Table 3, 4)
| Run | X1 | X2 | WF (g) | OFSP (g) | PP (g) | CP (%) | CA (%) | BC | P | TI | CL (%) |
|---|---|---|---|---|---|---|---|---|---|---|---|
| 1 | 1 | -1 | 678.46 | 170.83 | 150.71 | 11.37 | 1.40 | 0.16 | 1.13 | 10.94 | 2.00 |
| 2 | 1 | 1 | 678.46 | 194.73 | 126.81 | 9.63 | 1.00 | 0.20 | 1.20 | 10.86 | 5.00 |
| 3 | -1 | -1 | 616.86 | 203.24 | 179.90 | 10.51 | 1.00 | 0.17 | 1.21 | 10.73 | 6.75 |
| 4 | -1 | 1 | 616.86 | 231.68 | 151.46 | 10.51 | 1.00 | 0.19 | 1.15 | 10.36 | 4.50 |
| 5 | 2 | 0 | 702.38 | 169.87 | 127.75 | 10.50 | 1.23 | 0.17 | 1.26 | 10.02 | 4.35 |
| 6 | -2 | 0 | 576.27 | 241.85 | 181.88 | 10.51 | 1.40 | 0.21 | 1.25 | 10.47 | 3.75 |
| 7 | 0 | -2 | 650.35 | 168.51 | 181.14 | 11.38 | 1.00 | 0.14 | 1.19 | 10.36 | 5.69 |
| 8 | 0 | 2 | 650.35 | 221.60 | 128.05 | 10.06 | 0.86 | 0.19 | 1.16 | 10.20 | 2.40 |
| 9 | 0 | 0 | 650.35 | 199.61 | 150.04 | 9.63 | 1.71 | 0.20 | 1.26 | 6.27 | 5.05 |
| 10 | 0 | 0 | 650.35 | 199.61 | 150.04 | 10.51 | 1.00 | 0.15 | 1.17 | 9.64 | 4.10 |
| 11 | 0 | 0 | 650.35 | 199.61 | 150.04 | 11.37 | 1.01 | 0.17 | 1.21 | 6.80 | 4.58 |
| 12 | 0 | 0 | 650.35 | 199.61 | 150.04 | 10.94 | 1.01 | 0.17 | 1.21 | 7.57 | 4.82 |
| 13 | 0 | 0 | 650.35 | 199.61 | 150.04 | 10.50 | 1.02 | 0.17 | 1.23 | 8.22 | 4.58 |
| Run | X1 | X2 | WF (g) | OFSP (g) | PP (g) | CP (%) | CA (%) | BC | P | TI | CL (%) |
|---|---|---|---|---|---|---|---|---|---|---|---|
| 1 | 1 | -1 | 678.46 | 170.83 | 150.71 | 10.50 | 1.21 | 0.08 | 1.47 | 10.64 | 4.55 |
| 2 | 1 | 1 | 678.46 | 194.73 | 126.81 | 10.24 | 1.02 | 0.08 | 1.25 | 10.66 | 4.70 |
| 3 | -1 | -1 | 616.86 | 203.24 | 179.90 | 10.50 | 1.40 | 0.12 | 1.23 | 10.50 | 4.50 |
| 4 | -1 | 1 | 616.86 | 231.68 | 151.46 | 10.52 | 1.12 | 0.05 | 1.27 | 9.51 | 5.50 |
| 5 | 2 | 0 | 702.38 | 169.87 | 127.75 | 11.37 | 1.92 | 0.04 | 1.24 | 9.86 | 3.50 |
| 6 | -2 | 0 | 576.27 | 241.85 | 181.88 | 11.43 | 2.01 | 0.10 | 1.33 | 10.66 | 5.30 |
| 7 | 0 | -2 | 650.35 | 168.51 | 181.14 | 11.38 | 1.11 | 0.07 | 1.80 | 10.12 | 5.30 |
| 8 | 0 | 2 | 650.35 | 221.60 | 128.05 | 11.37 | 1.02 | 0.08 | 1.31 | 10.07 | 6.60 |
| 9 | 0 | 0 | 650.35 | 199.61 | 150.04 | 11.02 | 1.21 | 0.08 | 1.26 | 8.08 | 4.40 |
| 10 | 0 | 0 | 650.35 | 199.61 | 150.04 | 9.63 | 1.70 | 0.09 | 1.30 | 9.26 | 7.90 |
| 11 | 0 | 0 | 650.35 | 199.61 | 150.04 | 10.33 | 1.60 | 0.08 | 1.12 | 9.73 | 6.20 |
| 12 | 0 | 0 | 650.35 | 199.61 | 150.04 | 10.33 | 1.50 | 0.08 | 1.12 | 9.02 | 5.30 |
| 13 | 0 | 0 | 650.35 | 199.61 | 150.04 | 10.67 | 1.41 | 0.08 | 1.11 | 8.91 | 6.20 |
Result of optimization of the composite flour from MD blends
The optimized ingredients for the formulation and the predicted responses are as presented in (Table 5).
| Variable (V) Responses (R) | Goal | Lower limit (g) | Upper limit (g) | Importance | Optimum (g) |
|---|---|---|---|---|---|
| Semolina (V) | Is in range | 576.27 | 702.38 | 3 | 608.625 |
| OFSP (V) | Is in range | 168.51 | 241.85 | 3 | 241.85 |
| Pigeon pea (V) | Is in range | 126.81 | 181.88 | 3 | 149.525 |
| Crude protein (R) | Maximize | 10.54 | 11.30 | 3 | 10.542 |
| Crude ash (R) | Maximize | 1.22 | 1.57 | 3 | 1.148 |
| Beta-carotene (R) | Maximize | 0.433 | 1.004 | 3 | 0.20 |
| Phytate (R) | Minimize | 2.016 | 2.346 | 3 | 1.194 |
| Trypsin inhibitor (R) | Minimize | 30.723 | 35.562 | 3 | 6.265 |
| Cookingloss(R) | Minimize | 4.10 | 17.25 | 3 | 2.113 |
Result of optimization of the composite flour from KJ blends
The optimized ingredients for the formulation and the predicted responses are as presented in (Table 6).
| Variable (V) Responses (R) | Goal | Lower limit (g) | Upper limit (g) | Importance | Optimum (g) |
|---|---|---|---|---|---|
| Semolina (V) | Is in range | 576.27 | 702.38 | 3 | 649.702 |
| OFSP (V) | Is in range | 168.51 | 241.85 | 3 | 180.894 |
| Pigeon pea (V) | Is in range | 126.81 | 181.88 | 3 | 169.404 |
| Crude protein (R) | Maximize | 10.54 | 11.30 | 3 | 10.761 |
| Crude ash (R) | Maximize | 1.22 | 1.57 | 3 | 1.385 |
| Beta-carotene (R) | Maximize | 0.433 | 1.004 | 3 | 0.083 |
| Phytate (R) | Minimize | 2.016 | 2.346 | 3 | 0.889 |
| Trypsin inhibitor (R) | Minimize | 30.723 | 35.562 | 3 | 9.730 |
| Cooking loss (R) | Minimize | 4.10 | 17.25 | 3 | 4.705 |
Optimization of wheat flour - OFSP - Pigeon pea flour mixture
The best mixture of numerical optimization within the experimental range of the variable studies is usually selected based on desirability of 1.00 of highest desirability as the case may be (Jerkovic et al., 2016). Optimized formulation was obtained for wheat, OFSP and pigeon pea at 608.63 g-241.85 g-149.53 g (MD) and 649.70 g-180.89 g-169.404 g (KJ), respectively through Design Expert 6.0 6. These formulations were used to produce composite flour and for the production of the macaroni.
Cooking quality of the macaroni with MD flour
(Table 7) shows the cooking quality of the control and optimized MD macaroni. The cooking time for control and optimized samples are 14min and 17min respectively. Low cooking time was observed for control sample. Cooking time of the pasta is generally influenced by the rate of water movement in pasta and subsequent starch gelatinization (Sozer and Kaya, 2008).
| Samples | Cooking Time | Rehydration | Cooking Loss |
|---|---|---|---|
| Control | 14.00 ± 1.414 | 7.20 ± 0.283 | 6.63 ± 0.424 |
| Optimized | 17.00 ± 2.820 | 9.50 ± 0.707 | 12.00 ± 1.414 |
The cooking loss for control and optimized samples are 6.63% and 14% respectively. Cooking loss is the quantity of the dried solids leached in cooking water of noodles. The cooking loss of optimized sample was higher than control sample. This might be due to the fact that polymer interaction in protein–gluten network can encapsulate the starch granules. Nevertheless, competing for water, protein can speed up the loss of starch (Pu, et al., 2017). Previous studies also demonstrated that cooking loss could be due to the disruption of the protein starch matrix through diluted gluten fraction in case of oat flour (Aydin and Gocmen, 2011)
Rehydration for control and optimized samples are 7.20 % and 9.50 % respectively. Percentage rehydration of optimized sample is higher than control sample. Relatively higher % Rehydration yield may indicate more starch and protein of OFSP and pigeon pea. Due to the higher amount and amylose content in OFSP, starch is likely to expand when mixed with water after the enlargement in the protein–gluten network (Majzoobi, et al.,2011).
Cooking quality of the macaroni with KJ flour
(Table 8) shows the cooking quality of the control and optimized KJ flour macaroni. The cooking time for control and optimized samples are 14min and 17min respectively. Low cooking time was observed for control sample. Cooking time of the pasta is generally influenced by the rate of water movement in pasta and subsequent starch gelatinization (Sozer and Kaya, 2008).
| Samples | Cooking Time (mins) | Rehydration (%) | Cooking Loss (%) |
|---|---|---|---|
| Control | 14.00 ± 1.414 | 7.20 ± 0.283 | 6.63 ± 0.283 |
| Optimized | 17.00 ± 2.828 | 11.60 ± 0.849 | 14.00 ± 1.414 |
The cooking loss for control and optimized samples are 6.63 % and 12 % respectively. Cooking loss is the quantity of the dried solids leached in cooking water of noodles. The cooking loss of optimized sample was higher than control sample. This might be due to the fact that polymer interaction in protein–gluten network can encapsulate the starch granules. Nevertheless, competing for water, protein can speed up the loss of starch (Pu et al.,2017). Previous studies also demonstrated that cooking loss could be due to the disruption of the protein starch matrix through diluted gluten fraction in case of oat flour (Aydin and Gocmen, 2011)
Percentage rehydration for control and optimized samples are 7.20 % and 11.60 % respectively. Percentage rehydration of optimized sample is higher than control sample. Relatively higher % rehydration yield may indicate more starch and protein of OFSP and pigeon pea. Due to the higher amount and amylose content in OFSP, starch is likely to expand when mixed with water after the enlargement in the protein–gluten network (Majzoobi et al. 2011).
Consumer (hedonic) test of the macaroni made from MD composite flour blend
Consumer sensory scores for macaroni samples are shown in (Table 9). The color for control and optimized samples are 6.10 and 5.79 respectively. Control sample is slightly higher than optimized sample, this could be attributed to color of pigeon pea and OFSP added. The texture for control and optimized samples are 5.93 and 6.21 respectively, optimized sample is slightly higher than control sample. This was probably due to the persistence of the particulate form of the corn gluten meal in the cooked macaroni. The taste for control and optimized samples are 6.38 and 5.83 respectively, the taste of the pigeon pea and OFSP might slightly contribute to low value for optimized samples. The aroma for control and optimized samples are 6.72 and 5.83 respectively while mouthfeel for control and optimized samples are 6.79 and 6.28 respectively. There was no significant difference in mouthfeel of the two samples. The overall acceptability of control is a bit higher than optimized sample. The result of sensory evaluation showed that addition of OFSP (MD) and pigeon pea slightly affected the sensory attributes of macaroni.
| Samples | Colour | Texture | Taste | Aroma | Mouthfeel | Overall acceptability |
|---|---|---|---|---|---|---|
| Control | 6.10 ± 1.472 | 5.93 ± 1.334 | 6.38 ± 1.761 | 6.72 ± 1.729 | 6.79 ± 1.346 | 7.21 ± 1.292 |
| Optimized | 5.79 ± 2.042 | 6.21 ± 1.473 | 5.03 ± 1.649 | 5.83 ± 2.037 | 6.17 ± 2.465 | 6.76 ± 1.826 |
Consumer (hedonic) test of the macaroni made from KJ composite flour blend
Consumer sensory scores for macaroni samples are shown in (Table 10). The color for control and optimized samples are 6.10 and 5.21 respectively. Control sample is slightly higher than optimized sample, this could be attributed to color of pigeon pea and OFSP added. The texture for control and optimized samples were 5.93 and 5.93 respectively, there was no significant difference between the two samples. The taste for control and optimized samples are 6.38 and 5.79 respectively, the taste of the pigeon pea and OFSP might slightly contributed to low value for optimized samples. The aroma for control and optimized samples are 6.724 and 6.17 respectively while mouthfeel for control and optimized samples are 6.79 and 6.28 respectively.
| Samples | Colour | Texture | Taste | Aroma | Mouthfeel | Overall acceptability |
|---|---|---|---|---|---|---|
| Control | 6.10 ± 1.472 | 5.93 ± 1.334 | 6.38 ± 1.761 | 6.72 ± 1.730 | 6.79 ± 1.346 | 7.21 ± 1.292 |
| Optimized | 5.21 ± 2.111 | 5.93 ± 1.624 | 5.79 ± 1.567 | 6.17 ± 2.054 | 6.45 ± 1.900 | 6.62 ± 2.177 |
There was no significant difference in mouthfeel of the two samples. The overall acceptability of control sample is a bit higher than optimized sample. The result of sensory evaluation showed that addition of OFSP (KJ) and pigeon pea has no much effect on the sensory attributes of macaroni.
Descriptive sensory test of the macaroni made from MD composite flour blend
The results of discriminative analysis are shown in (Table 11). Colour ranged from 2.44 to 2.22 for control and optimized samples respectively. There was no significant difference between the two samples. Firmness for control and optimized samples are 3.17 and 2.65 respectively. Firmness is the ability of the pasta to maintain its shape after cooking. Control sample is more firm than optimized sample due to pigeon pea present in the blend. Stickness for control and optimized samples are 2.30 and 3.09 respectively. Stickness is the degree of adherence of the pasta to the teeth and the tongue. Optimized sample is sticky than the control sample. In macaroni sensory stickiness is related to the amount of amylose leached from the gelatinized starch granules and it is not strongly affected by protein content. (Del Nobile et al.,2005). This could be attributed to higher stickness of optimized sample. Pigeon pea and OFSP affected both to firmness and stickness of the product.
| Samples | Colour | Firmness | Stickness |
|---|---|---|---|
| Control | 2.48 ± 0.770 | 3.12 ± 0.666 | 2.36 ± 0.757 |
| Optimized | 2.28 ± 0.843 | 2.68 ± 1.070 | 3.04 ± 0.806 |
Descriptive sensory test of the macaroni made from KJ composite flour blend
The results of discriminative analysis are shown in (Table 12). Colour ranged from 2.44 to 2.26 for control and optimized samples respectively. There was no significant difference between the two samples. Firmness for control and optimized samples are 3.17 and 2.91 respectively. Firmness is the ability of the pasta to maintain its shape after cooking. Control sample is more firm than optimized sample due to pigeon pea present in the blend. Stickness for control and optimized samples are 2.30 and 2.87 respectively. Stickness is the degree of adherence of the pasta to the teeth and the tongue. There was no significant difference between the two samples. There was little effect of pigeon pea and OFSP on the color and fimness of the macaroni product, except slight differences in stickness.
| Samples | Colour | Firmness | Stickness |
|---|---|---|---|
| Control | 2.48 ± 0.771 | 3.12 ± 0.666 | 2.36 ± 0.757 |
| Optimized | 1.80 ± 1.000 | 2.76 ± 1.052 | 3.00 ± 1.000 |
It was established that substitution of both pigeon pea and OFSP (MD and KJ) in the blend increase the protein, ash and beta-carotene content while pigeon pea caused increase in phytate, trypsin inhibitors and cooking loss. For optimization, optimum level for MD based blend (semolina-OFSP (MD)-pigeon pea) was 608.63 g-241.85 g- 149.53 g while the optimum level for KJ based blend (semolina-OFSP (KJ)-pigeon pea) was 649.70 g-180.90 g-169.40 g and was successfully validated and established. From the study, it can be concluded that pasta made with optimized semolina, OFSP and pigeon pea based was nutritionally superior and helps to promote utilization of OFSP and pigeon pea in urban and rural areas and to open new markets for farmers to improve their income. Moreover the results of this study could provide the industry useful information about potential utilization of OFSP and pigeon pea in food formulations and product development for new functional foods.
AACC, 2005. Approved methods of AACC; American Association of Cereal Chemists, st. Paul MN.
Adebayo AA, Rasheed AS, Joseph AA, Beatrice OO, Olaitan OB, et al. (2017). Seed yield and proximate composition of pigeon pea (Cajanus cajan) seeds from varying planting distances.
AOAC, (2000). Association of Official Analytical Chemists. Official Methods of Analysis, 15th ed. Arlington, VA., USA. 2000.
Aydin E & Gocmen D (2011). Cooking quality and sensorial properties of noodle supplemented with oat flour. Food Sci Biotechnol. 20:507–511.
Indexed at, Google Scholar, Cross Ref
Camire ME (2001). Extrusion and nutritional quality. Extrusion Cooking: Technologies and Application. 108-130.
Indexed at, Google Scholar, Cross Ref
Del Nobile MA, Baiano A, Conte A & Mocci G (2005). Influence of protein content on spaghetti cooking quality. J Cereal Sci. 41(3):347-356.
Indexed at, Google Scholar, Cross Ref
Fasoyiro SB, Akande SR, Arowora KA, Sodeko OO, Sulaiman PO, et al. (2010). Physico-chemical and sensory properties of pigeon pea (Cajanus cajan) flours. Afr J Food Sci. 4(3): 120-126.
Jerković I, Rajić M, Marijanović Z, Bilić M & Jokić S (2016). Optimization of supercritical CO2 extraction of dried Helichrysum italicum flower by response surface methodology: GC-MS profile of the extracts and essential oil. J Sep Sci Technol. 51(18):2925-2913.
Indexed at, Google Scholar, Cross Ref
Majzoobi M, Ostovan R & Farahnaky A (2011). Effects of hydroxypropyl cellulose on the quality of wheat flour spaghetti. J Texture Stud.42 (1):20-30.
Indexed at, Google Scholar, Cross Ref
Omeire GC, Umeji OF & Obasi NE (2014). Acceptability of noodles produced from blends of wheat, acha and soybean composite flours. Niger Food J. 32(1): 31-37.
Indexed at, Google Scholar, Cross Ref
Onabanjo OO & Ighere DA (2014). Nutritional, functional and sensory properties of biscuit produced from wheat-sweetpotato composite. J Food Tech Res. 1(2):111–121.
Indexed at, Google Scholar, Cross Ref
Preedy VR & Watson RR (2011). Flour and breads and their fortification in health and disease prevention. London: Academic Press.
Indexed at, Google Scholar, Cross Ref
Pu H, Wei J, Wang LE, Huang J, Chen X, et al. (2017). Effects of potato/wheat flours ratio on mixing properties of dough and quality of noodles. J Cereal Sci. 76: 236–242.
Indexed at, Google Scholar, Cross Ref
Singh J, Dartois A & Kaur L (2010). Starch digestibility in food matrix: A review. Trends Food Sci. 21: 168-180.
Indexed at, Google Scholar, Cross Ref
Sozer N & Kaya A (2008). The effect of cooking water composition on textural and cooking properties of spaghetti. Int J Food Prop. 11(2): 351-362.