Full Length Research Article - African Journal of Food Science and Technology ( 2023) Volume 14, Issue 2
Received: 21-Dec-2022, Manuscript No. AJFST-22-84318; Editor assigned: 23-Dec-2022, Pre QC No. AJFST-22-84318; Reviewed: 20-Jan-2023, QC No. AJFST-22-84318; Revised: 27-Jan-2023, Manuscript No. AJFST-22-84318; Published: 06-Feb-2023, DOI: http:/dx.doi.org/10.14303//ajfst.2023.006
Challenges of food security in developing countries has in recent years made researches to be directed towards the development of foods with improved protein quality by the use of blends of legumes and cereals which are considered to be nutritionally balanced. In this wise, yoghurts were produced from local plant raw materials and their blends including Cajanus cajan (Fiofio), Vignia ungiculata (Akidi oji) and Vignia subterranea (Okpa) which are underutilized local foods. Commercial Cowbell milk was also used for the yoghurt production as control. The work also assessed the effect of using sorghum and millet steep waters as starter cultures as a possible replacement for the commercial starter cultures which encompasses lactic acid producing bacteria (Lactobacillus bulgaricus and Streptococcus thermophilus). 22 yoghurt samples were prepared (A1234, B1234, C1234, D, E123, F1234 and G123. they were subjected to proximate, phytochemicals, minerals, vitamins, chemicals, microbial analysis as well as sensory evaluation with a view of understanding the consumer acceptability of the products. Commercially acceptable yoghurt brand- Hollandia yoghurt was also analyzed and used as overall control (sample D). The data generated were analyzed using one-way ANOVA followed by Tukey’s post hoc test and significant difference set at (p<0.05). The result indicated the presence of alkaloids (0.3 - 1.2mg), flavonoids (0.7 - 2.6mg), saponin (0.1 - 0.8mg), tannins (0.2 - 1.2mg) and oxalate (0.1 - 0.5mg). Vitamins, calcium (6.0 - 19.33mg), potassium (1.2 -24.59mg), magnesium (0.70 - 6.65mg), sulphur (0.0 - 0.1mg) and phosphorus (78 - 166mg) were at acceptable levels. These and other parameters studied varied significantly (p<0.05) for samples fermented with commercial starter culture, sorghum and millet steep water. The microbial result revealed that total viable count (TVC) ranged from 1.0 x 10⁵ minimum to 7.2 x 10⁵ maximum, pathogenic bacteria was not seen (nil). Both total viable count (TVC) and pathogenic bacteria were in a tolerable level for the three cultures. The result showed significant differences (p<0.05) in aroma, appearance, taste, texture and overall acceptance among the different yoghurt samples and fermented cultures. Consequently, yoghurt was successfully produced from local plant raw materials and there is possibility of using sorghum and millet steep water as a substitute for commercial starter culture.
Yoghurt, Quality assessment, Sorghum, Millet steep and commercial starter culture.
Yoghurt is a fermented dairy product obtained from lactic acid fermentation of milk (Ihemeje et al., 2015). According to the Code of Federal Regulations of the United States Food and Drug Administration (FDA, 2013), yoghurt can be defined as foods produced by activities of a characteristic bacterial culture that contains lactic acid producing bacteria, Lactobacillus bulgaricus and Streptococcus thermophilus on some ingredients namely, cream, milk, partially skimmed milk, and skim milk, either alone or in combination. Yogurt is one of the most consumed healthy and nutritious foodstuff worldwide (Adriana et al., 2018; Shi et al., 2017; Zhi et al., 2018). Yoghurt is “a fermented product obtained by means of anaerobic fermentation of lactose in milk with relevant micro-organisms (Lactobacillus bulgaricus and Streptococcus thermophilus) which are classified as ‘probiotic’ (friendly, or harmless) microorganisms (Sanful, 2009). Market reports shows that the yoghurt market is projected to reach at $107,209 million by 2023, which stands for 4.5% growth over 10 years (Prasannan, 2017). Yoghurt is one of the most popular fermented dairy products which have a wide acceptance worldwide. The origin of yoghurt is not well known but believed to be dated back to the 6000 BC when the Neolithic people in the Central Asia transformed from a status of food gatherers to food producers when they began the practice of milking their animals (National Yoghurt Association, 2013a). It is generally accepted that the fermented milk products including yoghurts have been discovered accidentally when they used to store milk in sheep-skin bags and unused milk will get sour. Fermentation of milk has therefore evolved over centuries into commercial yoghurt making which paved the way for different commercially available varieties with a range of flavours, forms and textures (National Yoghurt Association, 2013b). The composition requirement for milk fat and milk solids non-fat is applied to the yoghurt prior to the addition of bulky flavoring ingredients according to United State Department of Agriculture (2016) specifications for yoghurt.
Yogurt is considered as healthy food due to its high digestibility and bioavailability of nutrients as recommended to the people with lactose intolerance, gastrointestinal disorders such as inflammatory bowel disease and irritable bowel disease. Yoghurt also aids in immune function and weight control. Based on these health benefits associated with yogurt consumption, there is an increasing demand for yoghurts making it the fastest growing dairy drink product (National Yogurt Association, 2013a). The plant raw materials for this study are among the underutilized legumes in Nigeria as well as other African countries. None of them has assumed the status of staple food as maize, rice wheat or cassava. So, the production of yoghurts using these underutilized legumes is a step in the right direction (Hutkins, 2006).
Collection of Materials
The Cowbell milk powder was bought from Cenapo Supermarket in Okigwe, Imo State. The cereals: sorghum and millet as well as the legumes Cajanus cajan, Vignia ungiculata and Vignia subterranea were bought from Akwata market, in Enugu State Nigeria and were identified properly by plant specialist in the Department of Plant Science and Biotechnology, Abia State University, Uturu. The commercial starter culture Pascaul Greek (Estilo Griego) was sourced from Shoprite outlet, Abia Mall, Umahia Abia State Nigeria (Tolo, 2014).
Sample Preparation
The plant materials for yoghurt production were sorted to eliminate spoilt ones. The sorted seeds were weighed out, and de-hulled and foreign materials removed especially, unhealthy nuts and seeds which could affect the taste and quality of the yoghurt. 300g of each of the legumes seeds was washed and rinsed with potable water, wet milled separately into slurry with 1.5 liters of potable water using cleaned Silver Crest blender model: SC 1589(5000W), and the milk extracted subsequently from the resulting slurry of each plant by pressured squeeze using muslin cloth. The extracted milk of the individual grain was pasteurized separately to 82°C for 10 minutes and cooled to a temperature of 42°C. 200ml of each was transferred to different labeled containers and starter culture introduced (Ugbogu, 2017).
Production Using the Commercial Cowbell Milk powder
400g of commercial cowbell milk powder was fused in 2liters of warm water and stirred thoroughly to give a homogenous mixture (United Kingdom Food Standards Agency 2011). The mixture was heated to 82°C for 10 minutes for pasteurization, and was made to cool to a temperature of 42°C. 200ml each was transferred to labeled sample containers, followed by the introduction of starter culture which promoted the fermentation process.
Formulation of yoghurt production from 3 legumes crop and conventional milk such as
Cowbell milk…………. A1
Okpa extract…………...A2
Akidi oji extract………. A3
Fiofio extract…………. A4
Hollandia Yoghurt……. D
Sample A
100%A1 (control)
100%A2
100%A3
100%A4
Fermented with commercial starter culture
Sample B
100%B1 (control)
100%B2
100%B3
100%B4
Fermented with sorghum culture
Sample C
100%C1 (control)
100%C2
100%C3
100%C4
Fermented with millet culture
Sample D (for comparison)
Sample E (variation)
E1 = 50%A2 and50%A3
E2 = 50%A2 and50%A4
E3 = 50%A3 and50%A4
Fermented with commercial starter culture
Sample F (variation)
F1 = 50%A2 and50%A3
F2 = 50%A2 and50%A4
F3 = 50%A3 and50%A4
Fermented with sorghum starter culture
Sample G (variation)
G1 = 50%A2 and50%A3
G2 = 50%A2 and50%A4
G3 = 50%A3 and50%A4
Fermented with millet starter culture
Total of 22 samples of yoghurts were produced and assessed.
Proximate Analysis
Determination of nitrogen/crude protein
The micro-Kjedahl method as described in Pearson (1976) was used for the determination of nitrogen/crude protein in the samples. It involved the estimation of the total nitrogen in the sample and the conversion of the nitrogen to protein with the assumption that all the protein in the sample is present as nitrogen. Using a conversion factor of 6.25, the actual percentage of protein in the samples was calculated as: % crude protein % Nitrogen x 6.25.
Determination of Moisture, Ash, Content, and Crude fibre were determined according to AOAC Method (1990).
Fat was determined according to Pearson (1976) method.
Carbohydrate content was determined according to the method described by AOAC (2015)
Analysis of Flavonoid was determined according to the method of Boham and Kocipai (1974).
Alkaloids was done according to Harborne while other phytochemicals such as tannins and oxalate were by the method of Pearson (1976) and Saponins was determined according to the method described by Obadoni & Ochuko.
Determination of phosphorous
Phosphorous content was determined by ashing the sample in the presence of zinc oxide followed by colorimetric measurement of phosphorous as molybdenum blue as described by AOAC (2010)
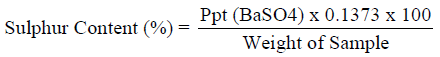
Determination of sulphur (Eschka Method)
1g of the pulverized sample was mixed with 3g of a mixture of magnesium oxide and anhydrous sodium carbonate (2:1). The mixture was heated to 400 0C for two hours in a muffle furnace. Cooled and digested in water. Barium chloride was added to precipitate the sulphate as barium sulphate. The amount of sulphur determined as described by (ASTM, 1992).
Mineral Analysis
Determination of phosphorous (Eschka method)
Phosphorous content was determined by ashing the sample in the presence of zinc oxide followed by colorimetric measurement of phosphorous as molybdenum blue according to (ASTM, 1992)
Determination of metals: calcium, potassium and magnesium content
30cm3 of aqua regia (a mixture of HNO3 and HCI in the ratio of 1:3); de-ionized water, double distilled water, conc. HCI, 3M HNO3. Atomic Adsorption Spectrometer model AA-7000 Shimadzu, Japan ROM version 1.01, S/N A30664700709 was used for the analysis of Calcium, Potassium, and Magnesium content respectively.
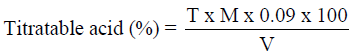
Analysis of titratable acidity
Total titratable acidity was determined by the method described by (AOAC, 2010). About 5ml of the sample solution was taken and titrated with 0.1N NaOH using phenolphthalein as indicator.
Titration continued until there was a change in colour to a pink endpoint.
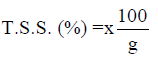
Total soluble solids (T.S.S)
The percentage of T.S.S was calculated as shown below:
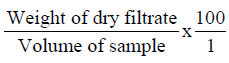
Determination of milk solids non-fat (M.S.N.F)
This was done by calculation after the determination of the lactometer reading.
%M.S.N. F = 0.25LR + 0.2F + 0.4 % Fat and LR Lactometer reading.
Determination of pH was determined using a Jenway pH meter model 3510
Determination of vitamin A
The procedure of Jakkutowicz et al. (1977) was used. One gram of the sample was weighed. Then, the proteins were first precipitated with 3m1 of absolute ethanol before the extraction of vit A with 5m1 of heptane. The test tube containing this was shaken vigorously for 5mm. on standing; 3ml from the heptane layer was taken up in a cuvette and read at 450nm against a blank of heptane. The standard was prepared and read at 450nm wavelength and vitamin A calculated from the standard.
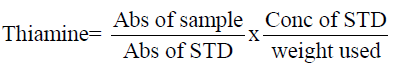
Determination of thiamin (Vitamin B1)
Thiamin complex was extracted with dilute HCI and the resultant solution treated with phosphatase enzyme to Liberate free thiamine. 1g of the sample was weighed into a flask and l00mI of O.2NHCI was added and heated to boil for 30mins on a water bath. Cooled, 5ml of phosphatase enzyme added and incubated at 37°C, filtered and added 2-3g of anhydrous Na2SO4. 5ml of the solution was measured into 5m1 stopped flask and added 3m1 of 15% NaOH. The absorbance was taken at 435nm wavelength. Thiamin was calculated as follow:
Determination of riboflavin (Vitamin B2)
Riboflavin was extracted with dilute acids and then quantified after removing the interfering substances by treatment with KMnO4. 5mg weight of the sample was taken. 50ml of 0.2 NHCl was added and boiled on a water bath for 1hr, cooled and the pH adjusted to 6.0 using NaOH. 1NHCl was added to lower the pH to 4.5 then filtered in a l00ml measuring flask and the volume was made up to the mark. l0ml aliquot was taken from l00ml volume and 1ml of acetic acid (glacial) was added to each tube, mixed and then 0.5ml of 3% KMnO4 solution was added. Kept away for 2min and then added 0.5m1 of 3% H2O2 and mix well before taking your reading at 470nm.
Calculate for riboflavin as follows

Analysis of ascorbic acid (Vitamin C)
5g of sample was weighed into a l00ml volumetric flasks and added 2.5ml of 20% meta-phosphoric acid was added as stabilizing agent and diluted to with distilled water. 10ml of the solution was collected with a pipette into a small flask and 2.5ml acetone added. Titrated with the indophenol’s solution until faint pink colour persisted for 15 seconds. Vitamin C was calculated in the sample as mg/100ml in deeply coloured solution. UV spectrophotometer at wavelength of 264nm using water was used in the calculation (Okonkwo, 2017).
Analysis of vitamin E
1g of sample was weighed into l00mI flask fitted with reflux condenser. 10ml absolute alcohol and 20ml M alcoholic sulphuric acid was added. Refluxed for 45mins and cooled. 50ml of distilled water were added and transferred into a separating funnel with acid of further 50 ml of water. Extracted with 30ml of diethyl ether. The extract was evaporated with very low heat. The residue was dissolved with 10 ml absolute ethanol. Aliquots of the solution and standards (0.3-3.0mg of Vit. E) transferred into a 200 ml volumetric flask. 5ml absolute alcohol added, followed by 1ml conc. Nitric acid drop wise with swirling(Okonkwo, 2016). Placed in a water bath at 90C for 3mins. Cooled under running tap and adjusted to volume with alcohol. The absorbance was measured at 470 nm against a blank containing 5ml absolute alcohol and 1ml nitric acid.
Microbial Analyses
The microorganisms in samples were cultivated and identified using surface viable count method (Miles & Misra, 1938) Total Viable Count (number of Living Micro-Organisms). The method used was surface viable count. The suspension obtained from the isolation of bacteria was diluted with sterile distilled water using sterile pipette. The aim was to obtain a dilution that contained approximately 30 cells per 0.01 5m1 or 0.015 volumes per drop. Agar plates were divided into eight segments with an indelible marker. A drop of the suspension was inoculated on each segment. These plates were then incubated for 24 hours at 37°C. Developed colonies were counted from the equation below

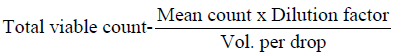
Dilution factor = 104
Volume per drop 0.01 5m1
Isolation of bacteria
One grain of the sample was weighed and transferred into sterile test tubes. Sterile saline solution (1 Omi) was transferred to the test tubes containing the samples. The mixture was shaken to obtain uniformity. It was then allowed to set and the supernatant served as the inoculums. Using a sterile loop, a loop full of the supernatant was collected and streaked on the nutrient agar plate. The plates were incubated at 37°C for 48 hours. After the incubation period, the plates were carefully inspected for growth of bacteria.
Identification of pathogenic bacteria
Some suspected colonies of pathogenic bacteria from the isolation above were identified with Isolation and Identification of Fungi. Selective media Gram-negative rods were grown on Mackonkey agar, cetrimide and desoxcollate citrate agar. Cocci shaped organisms were grown on mannitol agar. The same procedure adopted for isolation and identification of bacteria above was also used for that of fungi in the samples. But in place of nutrient agar, Saboround dextrose agar (SDA) was used. 1g of the sample was collected with the sterile loop and streaked on SDA plates. The plates were incubated at 25 to 28°C for 48 hours. The fungi present in each of the samples was identified by microscopy.
Sensory analysis
Samples were subjected to sensory evaluation using 9-point hedonic method (9 = excellent; 8= like very much; 7=like moderately; 6=like slightly; 5=neither like or dislike; 4= dislike slightly; 3= dislike moderately; 2= dislike very much 1 = extremely poor). 22 formulations sample A to G were examined on the basis of their quality attributes such as Aroma, Appearance, Taste, Texture and Overall acceptability by 36 untrained panelists who were students of JUPEB foundation, ABSU, were recruited and informed about the sensory test. An informed consent was obtained for sensory experimentation with the panelists and research has been carried out in accordance to (Sanful, 2009).
Statistical analysis
Data analysis for quality assessment and chemical measures were performed by analysis of variance and results of the sensory tests were analysed by non-parametric procedures for independent samples at a critical value of p<0.05. Results were related by a non-parametric procedure with Spearman's rank correlation coefficient using SPSS statistical software (version 27, SPSS Inc., Chicago, IL, USA). Mean values and standard deviation values were calculated. Sensory data were statistically tested using ANOVA to assess the difference (p < 0.05) and post-hoc analysis using Tukey's test was used for mean comparison between samples at a 98% confidence interval. Significance of individual independent variables, 98% confidence intervals and their standard errors of estimates are provided. In addition, sensory evaluation against instrumental analyses are represented in standardized forms of their mean values and standard deviations across all processing types. Also, bias from the commercial sample is shown to elucidate the effect of processing type against the commercial sample calculated amongst the standardized versions.
Proximate composition
The proximate parameters measured were crude protein, ash content, moisture content, crude fat, crude fiber, and carbohydrate as shown in (Figure 1). Compared to group D (Hollandia yoghurt), the proximate compositions of all the yoghurts (A1, 2, 3, 4, B1, 2, 3, 4, and C1, 2, 3, 4,) i.e. ABC1: 100% cowbell yoghurt, ABC2: 100% okpa yoghurt, ABC3: 100% akidi yoghurt, ABC4: 100% fiofio yoghurt, and combinations of plant sourced yoghurts 50% okpa +50% akidi, 50% okpa +50% fiofio, and 50% akidi +50% fiofio for (E1, 2, 3,) 50% okpa +50% akidi, 50% okpa +50% fiofio, and 50% akidi +50% fiofio for (F1, 2, 3,) and50% okpa +50% akidi, 50% okpa +50% fiofio, and 50% akidi +50% fiofio for (G1, 2, 3,) where EFG1 fermented with regular starter culture: EFG 2 fermented with sorghum culture, and EFG3 fermented with millet culture, slightly varied in composition.

Figure 1. Proximate composition of Yoghurts fermented with commercial starter, sorghum and millet steep water.
Sample A: Yoghurt fermented with regular culture, Sample B: yoghurt fermented with sorghum culture, Sample C: yoghurt fermented with millet culture, Sample D: commercial hollandia yoghurt as control, Sample E: varied yoghurt fermented with regular culture, Sample F: varied yoghurt fermented with sorghum culture and Sample G: varied yoghurt fermented with millet culture
The protein content was between the ranges of 1.66 % (B3) to 2.78 % (A1). In order words, the protein content decreased significantly (p<0.05) in yoghurts B3, G3, C3, F3, G2 C4, G1, E2 and B4 (1.66, 1.74, 1.75, 1.79, 1.83, 1.87, 1.88, 1.91 and 1.97%, respectively) and increased nonsignificantly (p>0.05) in yoghurt 100% A1 (2.78%) while the rest of the yoghurt samples recorded no significant difference(p<0.05) compared to the overall control yoghurt D (2.62). The result further revealed that the animal sourced yoghurt recorded the highest crude protein compared to the three plant-based yoghurts 100% (akidi, okpa, fiofio) and their 50% combinations. The values obtained here, correspond with the work of Ihemeje et al, (2015), also, similar results in low content of protein were reported by (Mbaeyi et al., 2017); Desouky et al.,2018) that protein content decreased in the fruit flavoured treatment with the accumulation of fruit juices because fruit juices are full of lower protein than milk. The declining concentration in protein content could be attributed to proteolytic activity of micro-organism which degrades the protein content due to high amount of acid content of fruit yoghurt The mean proportional level of protein present in all the yoghurt samples are nutritionally significant in terms of the potentials of these yoghurts to contribute to the increased protein intake by the consumers. The Crude protein has been reported to have some functional attributes such as water absorption, viscosity elasticity, foam stability and fibre formation (Sanful, 2009).
The result revealed that the ash content of yoghurt fermented with commercial starter, sorghum and millet steep water were statistically significant (p>0.05) (Sample A, B, C and E) when compared with the control (sample D) while more significantly differences were seen in varied samples (F and G). The highest value of ash content was recorded in sample 100% animal sourced yoghurts B1 (0.71%), followed by Sample A1 and C1 which recorded (0.58% each) while the lowest ash content was seen in 100% C3(0.09) B3(0.10), 50% F3, G2&3. (0.10 each). Although the ash content values obtained in this study were lower than the value obtained from the control yoghurt D (0.78), but it corresponds with the ash content values gotten by other researchers such as (Ihemeje et al., 2015; Joel et al., 2014). A similar performance was reported by Nath et al. (2020) who showed lower ash content in Almond and dark chocolate containing yogurt than the control yogurt. The content of ash in the samples is the indication of the mineral content which promote bone formation and mineralization (FOX, 1998).
The percentage crude fat significantly increased (p<0.05) in the 100% animal yoghurt A1 (1.90%) compared to the control yoghurt D (1.62), and significantly lowered (p>0.05) in the rest of the yoghurts{A234 to G123 i.e. 100% plant -based yoghurts and all the 50%combinations of plantbased yoghurts both treated with all the cultures: E (50% okpa + 50% akidi), F (50% okpa+ 50% fiofio), G (50% akidi + 50% fiofio)} except in some of the individual plant-based yoghurts B3 and C3 (akidi and okpa) treated with sorghum and millet culture, the decrease in crude fat (%) was very significant (p<0.05). The crude fat content of the yoghurts varies with the type of milk and nature of culture used. Yoghurts rich in oil content have been observed to contain “abundant fat and this could be due to the presence of polyunsaturated fatty acids, which are considered healthy for human body (Ogundele et al., 2015). In this investigation, all the yoghurts recorded appreciable values although little below minimal of NIS337:2004 range of 3.0. The decrease in fat content recorded in the samples may contribute to increased shelf life by decreasing the chances of rancidity, as higher fat content may easily contribute to the production of off flavour during storage (Olakunle, 2012). The Dietary Guidelines recommends that adult women get 1.5–2% tablespoons and adult men get 2–2.5% tablespoons of oils each day (ODPHP, 2016).
Moisture content expresses the water activity of substances such as food, and other perishable materials. From the Figure 1 , the results showed that the moisture content for all the treatment groups increased non-significantly (p>0.05) for all the experimental groups (A, B, C, E, F and G) compared to the control D (85.92%). Intriguingly, yoghurts made from akidi and okpa treated with sorghum and millet culture, B3 and C3 (94.32% and 94.13%), as well as their combinations G2 and G3 (91.43% and 92.82%), recorded the highest moisture content than the animal sourced yoghurt (82.69 least and 88.21 highest). The moisture content of this study slightly increased in yoghurts fermented with both regular, sorghum and millet steep water; with mostly those of the plant extraction, recorded higher number per cent (%); sample B3&4, C3&4, G3&2, A3&4, F3&1 and E (94.32% & 91.71%, 94.13% & 91.87%, 92.82% & 91.43%, 91.42% & 91.11%, 90.61% & 89.36%, and 89.73% respectively). Also, the slightly increments of moisture content observed in yoghurts of the animal source (sample A1, B1 &C1) could be as a result of reconstitution of the milk prior to fermentation (Ihemeje et al., 2015). The highest moisture content as recorded in akidi oji and fiofio i.e. plant base yoghurt B3&4 (94.32% and 91,71%) and C3&4, (94.13%) is in line with the work of Udeozor (2012) who demonstrated the proximate composition and sensory qualities of tiger nut-soy milk drink, while the moisture contents of some the yoghurts disagree with the range of most commercial yoghurts (80-86 %) as reported by Joel et al. (2014). However, moisture can be controlled by the addition of powdered milk or evaporation during pasteurization of milk for desired yoghourt (Stringer, 2000).
The percentage composition of crude fibre Figure 1, shows non-significantly difference (p>0.05) in all the yoghurts haven recorded an average of 1.0 to 2.0% apiece, in agreement with the control yoghurt D (2.0%) except in yoghurts of B3 and C3 (100% akidi and 100% okpa) treated with sorghum and millet cultures, that recorded 0% crude fibre each. A decrease of this value of crude fibre compared to control samples was also reported by (Adriana et al., 2018; Raju & Pal 2014). The indigestible components of plant material which include cellulose, hemicellulose, pectin, lignin and other plant material are collectively referred to as crude fibre or dietary fibre. It provides roughages, which contributes to a healthy condition of the intestine. Dietary fibres reduce the risk of cardiovascular diseases caused high blood cholesterol level by decreasing cholesterol level in the body (Anderson et al., 2000).
The percentage composition of carbohydrate was nonsignificantly (p<0.05) higher in A1 and A2 (100% cowbell and 100% okpa yoghurts both fermented with regular starter culture) haven scored 11.85% and 8.97% respectively compared to the control yoghurt D (8.64%). Other yoghurts were non-significantly (p>0.05) lower than the control, with yoghurt of B3 and C3 (100% akidi and 100% okpa) and G3 (50%akidi + 50%fiofio) treated with sorghum and millet cultures recorded lowest score of 3.07%, 3.03% and 4.04% respectively. The proximate composition of this study is similar to those reported by other researchers (Udeozor, 2012; Ogundele, 2015) respectively. Proximate composition is very useful for compilers of food composition tables and databases that could be used by economist, food service managers, agricultural planers, nutritionist, dieticians, food and agricultural scientist, food technologist, public health scientist etc.
Phytochemical composition
The phytochemical parameters measured were alkaloids, flavonoids, saponins, tannins, oxalates (Figure 2). The result revealed the quantity of alkaloids, flavonoids saponin, tanins and oxalate presenct in the various yoghurts produced. The quantity of alkaloid was not-significantly (p>0.05) lowered in animal-sourced yoghurt and all the plant-based yoghurts, except in group B3, C3 and G3, (akidi, akidi, and akidi + fiofio fermented with both sorghum and millet respectively) scored 0.4mg, 0.4mg and 0.3mg each. Remarkably, yoghurts of plants combination (E3, E1, F2 and A1 of animal source) recorded non-significant (p>0.05) increase (1.3, 1.4, 1.2 and 1.2 mg respectively) except least score 0.3mg of G3 (50% akidi + 50% fiofio) compare to the control D (1.0 mg).

Figure 2. Phytochemical composition of Yoghurts fermented with commercial starter, sorghum and millet steep water.
Sample A: yoghurt fermented with regular culture, Sample B: yoghurt fermented with sorghum culture, Sample C: yoghurt fermented with millet culture, Sample D: commercial hollandia yoghurt as control, Sample E: varied yoghurt fermented with regular culture, Sample F: varied yoghurt fermented with sorghum culture and Sample G: varied yoghurt fermented with millet culture
Flavonoid significantly decreased (p>0.05) in groups B3, C3, and G3 (0.9, 0.9 and 0.7 mg) compared to the control D (2.2 mg). However, the animal sourced and plants yoghurts treated with all the cultures varied non-significantly (p> 0.05) as A1 (2.6 mg) and E1 (2.5 mg) recorded the highest percentage flavonoid.
Saponin
There were non-significant differences between the saponin contents of yoghurt samples with the least value (0.2 mg) from G and E had the highest value (0.8 mg). The presence of saponin in moderate concentration is consistent with the report in the literature (Obidoa et al., 2010). Saponin have been shown to reduce blood glucose and insulin responses to starchy foods and or the plasma cholesterol and triglycerides. Furthermore, saponin have been reported to reduce cancer risk (Thompson, 1993). The presence of saponin in the samples could imply that consumption of these yoghurt samples has the potential to lower cholesterol levels in humans due to the hypocholesterolaemia effect of saponin (Osagie, 1998).
Tannin
The tannin content of the samples is shown in Figure 2 where tannin content of control and other yoghurt samples were almost the same value(1.1mg). It was suggested that the consumption of tannin-containing beverages can cure or prevent a variety of illnesses. Also, many human physiological activities, such as stimulation of phagocytic cells, host-mediated tumor activity, and a wide range of anti-infective actions, have been attributed to tannins.
There were non-significant (p>0.05) difference in the concentration of oxalate among the three cultures except for G2 and G3 which differ significantly (p>0.05) in oxalate 0.2mg compare to control D (0.5mg). Phytochemicals are important biochemical drivers. Over the years, its wide acceptance has been attributed to the following criteria: bio accumulation, bio availability, higher safety margin and ability to target biochemical pathways (Okereke & Anukam 2015).
Mineral composition
The mineral parameters evaluated were calcium, phosphorus, potassium, magnesium and sulphur contents (Figure 3). The results showed that the calcium content for all the treatment groups decreased non-significantly (p<0.05) for all the experimental groups except for 100% cowbell fermented with regular, sorghum and millet culture A1 (19.33nm), B1(14. 66nm) and C1(14.66nm) recorded highest score compared to the control D (14 nm), while all the plants yoghurt both the mixed in all the culture treatments recorded lower calcium concentration (5.33 nm) on average.

Figure 3. Mineral composition of Yoghurts fermented with commercial starter, sorghum and millet steep water.
Sample A: yoghurt fermented with regular culture, Sample B: yoghurt fermented with sorghum culture, Sample C: yoghurt fermented with millet culture, Sample D: commercial hollandia yoghurt as control, Sample E: varied yoghurt fermented with regular culture, Sample F: varied yoghurt fermented with sorghum culture and Sample G: varied yoghurt fermented with millet culture
The result of potassium shows non-significantly (p<0.05) difference among the yoghurts of both plants and animal sources (A1,2,3,4, B1,2,3,4 and C1,2,3,4) ranges from 1.23nm minimum to 6.03 nm maximum, treated with commercial culture, sorghum and millet compare with the control D (2.86nm), whereas yoghurts of plant combinations (E1,2,3, F1,2,3, and G1,2,3,) (ranges from 8.97nm minimum to 23.97nm maximum) recorded more significantly (p>0.05) increase compare to the individual yoghurts and the control D (2.8 nm).
Magnesium content for all the treatment groups increased non-significantly (p>0.05) above the yoghurt control D (4.38 nm) in all the experimental groups with the exception of B4 (3.84 nm), C1(3.92 nm) C3(3.98 nm), and F1 (0.70 nm) that were decreased non-significantly (p<0.05). Intriguingly, yoghurt made from 100% okpa (A2,) treated with commercial culture recorded the highest magnesium content (6.66 nm) followed by 50% okpa + 50% akidi E1 (5.952 nm).
There are non-significantly difference (p>0.05) in the phosphorus content for all the treatment groups in all the experimental groups (A, B, C, E, F and G) compared to the control (142.0 mg). However, some of the plant combinations E1(172.6 mg), E3 (184.0 mg) and F2 (166.2 mg) recorded the highest phosphorus concentration while 100% akidi and 100% okpa) treated with sorghum and millet cultures B3 (78.0 mg) and C3 (86.2 mg) were the least in concentration of phosphorus.
Sulphur content of all the treatment groups increased nonsignificantly (p>0.05) for all the experimental groups (A, B, C, E, F and G) compared to the control (0.0%). Remarkably, yoghurts made from plants and animal, as well as their combinations, recorded between 0.0 to 0.1 % of Sulphur concentration in relation with the control D (0.0%) value. This result of mineral concentration justifies the assertion of Gray that yoghurt is a very good source of essential minerals needed for human metabolism or functionality of cells (Ihemeje et al, 2015). The results also, are in conformity to the work of Mbaeyi et al., (2009) who demonstrated the effect of fermentation on the mineral composition of Ogi (fermented maize) blended with bambara groundnut. However, the results are not in agreement with FDA (2011) range of (Ca: 132ppm, P: 38.5ppm and Mg: 46.1ppm).
Vitamin content
The Vitamin content assessed include ascorbic acid, fat soluble vitamins (B complex) and water soluble vitamins (A.D.E.K) as enclosed in Figure 4. The result shows that the percentage (%) of Vitamin B1, were not-significantly lowered irrespective of fermented culture(p>0.05) in all of the 100% yoghurts with concentration range of B3C3 (0.01% each), A3A4B2B4C1C2C4(0.02mg each) and A2B1(0.03 mg each) excluding non-significantly increased cowbell A1 (0.05 mg) while 50% varied yoghurts irrespective of fermented culture were non-significantly increased (p<0.05) and recorded concentration range of E2F1G1 (0.05 mg each), F2(0.06 mg), E1(0.07 mg) and E3(0.08 mg) with exception of F3G2 (0.03 mg each) and G3 (0.01 mg) in comparison with the control yoghurt D (0.04 mg).

Figure 4. Vitamin composition of Yoghurts fermented with commercial starter, sorghum and millet steep water.
Sample A: yoghurt fermented with regular culture, Sample B: yoghurt fermented with sorghum culture, Sample C: yoghurt fermented with millet culture, Sample D: commercial hollandia yoghurt as control, Sample E: varied yoghurt fermented with regular culture, Sample F: varied yoghurt fermented with sorghum culture and Sample G: varied yoghurt fermented with millet culture
In a similar way, Vitamin B2 was non-significantly lowered irrespective of fermented culture(p>0.05) in all of the 100% yoghurts with concentration range of B3C3(0.05% each) B4C4(0.06 mg each), A3(0.07 mg), A4(0.08 mg), and A2B1B2C1C2 (0.10 mg each) excluding non-significantly increased cowbell A1 (0.16 mg) while 50% varied yoghurts irrespective of fermented culture were non-significantly increased (p<0.05) and recorded concentration range of E3(0.20 mg), E1(0.18 mg), F2(0.16 mg), E2(0.14 mg) with exception of F1(0.12 mg), G1(0.10 mg), F3(0.09 mg) G2(0.07 mg) and G3(0.02 mg) in comparison with the control yoghurt D (0.14 mg).
Also, Vitamin B3 was non-significantly lowered in any case of fermented culture(p>0.05) in all of the 100% yoghurts with concentration range of B3C3 (0.02 mg each), A3A4B4C4(0.04 mg each), B2C1C2(0.05 mg each) and A2B1(0.06 mg each) excluding the non-significantly increased cowbell A1 (0.10 mg) while 50% varied yoghurts irrespective of fermented culture were non-significantly increased (p<0.05) and recorded concentration range of E3(0.14%), E1(0.12%), F2(0.11%), E2(0.10mg) F1G1(0.09 mg each), with exception of F3(0.07mg) G2(0.05mg) and G3(0.02mg) in comparison with the control yoghurt D (0.08mg).
The trend was extended to Vitamin A, that was non-significantly lowered regardless of fermented culture(p>0.05) in all of the 100% yoghurts with concentration range of B3C3 (2.0 and 2.2ug), B4C4(3.8 and 3.7 ug), A3A4(4.1 and 4.3ug), B2C2(5.8ug each), C1(6.3mg) and A2B1(7.0ug each) excluding non-significantly increased cowbell A1 (10.2ug) while 50% varied yoghurts irrespective of fermented culture were non-significantly increased (p<0.05) and recorded concentration range of E3(11.4ug), E1F2(10.8 and 10.4ug), E2(9.6ug) F1(8.0ug) F2(0.06ug), and with exception of G1(7.6ug), F3(6.2ug), G2 (5.0ug) and G3 (3.8ug) in comparison with the control yoghurt D (7.9ug).
Vitamin D showed non-significant difference (p≤ 0.05) regardless of fermented culture in groups (A1, 2, 3, 4, B1, 2, 3, 4, C1, 2, 3, 4,) i.e. in all of the 100% yoghurts with concentration range of A3A4B3C3 (0.01mg each), A2B1 B2 B4 C1C2C4 (0.02mg each) except for A1(0.03mg) while 50% varied yoghurts irrespective of fermented culture were very significantly increased (p<0.05) and recorded concentration range of E3(0.06mg), E1F2(0.05mg each), E2F1(0.04mg each), F3G1(0.03mg each) and G2(0.02mg) together with G3 (0.01mg) recorded non significantly difference all in comparison with the control yoghurt D (0.02 mg).
Vitamin E also share non-significant difference (p≤ 0.05) irrespective of fermented culture(p>0.05) with almost all of the 100% yoghurts with concentration range of A3A4B3C3 (0.01mg each), A1A2B1B2B4C1C2C4(0.02mg each) while 50% varied yoghurts irrespective of fermented culture were non-significantly increased (p>0.05) and recorded concentration range of E1E3F2(0.03mg each), E2F1F3G1(0.02mg each) and G2G3(0.01mg each) recorded non significantly lower in comparison with the control yoghurt D (0.02mg).
Vitamin K was also similar to the preceded vitamins as it were non-significantly (p≤ 0.05) lower in all the fermented cultures (p>0.05) with almost all of the 100% yoghurts with concentration range of B3C3(7.0 and 7.2mg ), B4C4(8.6mg each), A3A4(9.4 and 9.8mg), C2(10.8mg), B2C1(11.0 and 11.2mg) and B1(12.0mg) except A1 A2 (15.8 and 12.6mg) while 50% varied yoghurts fermented in all the cultures were non-significantly increased (p>0.05) and recorded concentration range of E3 (17.2mg), E1(16.0mg), F2(15.8mg), E2 (14.2mg), F1(13.0mg), F3 G1(12.2mg) and G2(7.4mg) and G3(4.8mg) recorded more significantly lower in comparison with the control yoghurt D (12.0mg).
Vitamin C, was non-significantly lowered irrespective of fermented culture(p>0.05) in all of the 100% yoghurts with concentration ranged of B3C3 (0.06mg each), A3A4B4C4 (0.7mg each), B2C1C2(1.0mg each), and B1(1.2mg) excluding non-significantly increased cowbell A1 (1.4mg) and A2(1.3mg) while 50% varied yoghurts irrespective of fermented culture were non-significantly increased (p<0.05) and recorded concentration range of E3(1.8mg), E1(1.5mg) and F2(1.3mg), G1 (0.05mg each), and with exception of E2(1.1mg), F1(1.0mg), F3G2 (0.03mg each) and G3 (0.01mg) in comparison with the control yoghurt D (1.3mg). Vitamins are important nutritional components required for the normal functioning of the human body (USDA, 2014).
Chemical analysis
Chemical properties analyzed include: pH, titratable acidity (T. A), total soluble solids (T.S. S), viscosity (cP) and milk solid non-fat (M.N.S. F) Figure 5. The result revealed that milk solid non-fat (MNSF) composition was non-significantly (p>0.05) lowered in all of the yoghurts regardless of fermented culture, except in group A1, (15.41%) also A2 (12.19) 100% cowbell and 100% okpa respectively both fermented with commercial culture, compared to the control yoghurt D (12.24%).

Figure 5. Chemical analysis of Yoghurts fermented with commercial starter, sorghum and millet steep water.
Sample A: yoghurt fermented with regular culture, Sample B: yoghurt fermented with sorghum culture, Sample C: yoghurt fermented with millet culture, Sample D: commercial hollandia yoghurt as control, Sample E: varied yoghurt fermented with regular culture, Sample F: varied yoghurt fermented with sorghum culture and Sample G: varied yoghurt fermented with millet culture.
Also, the result of Viscosity was also non-significantly (p>0.05) lowered in all of the 100% yoghurts with concentration ranged between 92.0 to 140mpas while the 50% varied yoghurts also ranged between 45.2mpas to 331.8mpas as compared to the control yoghurt D (164.3mpas). Surprisingly, 50% varied yoghurts such as E1(268.5mpas), E3 (331.8mpas), F1, (228.2mpas) and F2, (237.2.5 mpas) recorded high concentration of viscosity than the yoghurt control D (164.3 mpas). and those of the 100% yoghurts. 50%akidi + fiofio yoghurt fermented with regular starter culture, highest concentration of viscosity E3 (331.8mpas), while 50%akidi + fiofio yoghurt fermented with millet steep water scored lowest concentration of viscosity G3(45.2mpas). Interestingly, viscosity results are in agreement with those obtained by Adriana et al, (2018); Crispín-Isidro et al. (2015) which reported that gel firmness increases at a level of 2-4mpas inulin addition.
The result revealed varied pH levels among the tested samples. The pH of the cowbell yoghurts and the uncombined plants i.e. 100% yoghurts A1, 2, 3, 4, B1, 2, 3, 4, and C1, 2, 3, 4,) fermented with commercial starter, sorghum and millet steep cultures were appreciably higher ranged from 6.3 to 8.1 (p<0.05) than those of the combined plant i.e. 50% yoghurts (E1, 2, 3, F1, 2,3 and G1, 2, 3) that ranged from 5.6% to 6.3. A highly-significant difference (p<0.05) was observed in the yoghurt of 100% group C1, C3 and B1, as they scored very more (8.1 7.7 and 7.3) respectively than the control yoghurt D (6.4). However, the general consensus about the pH value for acceptable and good quality product ranges between 3.5 and 4.6 according to (Tugba, 2022). Also, 3.38minimun and 4.80maximun for (Egyptian Standards (EOSQC), 2005).
The result further showed that there was no statistical difference in the level of total soluble solid (TSS) among the yoghurt samples that were fermented with commercial starter culture, sorghum and millet steep culture both the100% and 50% yoghurts except for yoghurts B3,4, C3,4 and G3 that recorded (0.00 % each) compared to the control D (0.10 %). The total solids are an indication of the dry matter content of the yoghurt samples (Joel et al., 2014; Belewu et al., 2010; Khalifa et al., 2011).
Titrated acidity (T. A) of the result showed high significantly reduction on group (C1, 2, 3, 4,) and non-significantly(p<0.05) lower among both yoghurts animal and plants source treated in all the cultures. Interestingly, group (E1, 2, 3) and G3 50% combination of plant fermented with the commercial starter culture recorded highly significantly (p<0.05) values (0.14, 0.14 and 0.16 % each) and (0.12 %) than the control sample D (0.10 %). Reason for the lower titrated acidity could be due to more availability of lactose to the fermenting microbes (Joel et al., 2014). However, these values of titrated acidity recorded are non-significantly(p<0.05) lower than the average of 0.6% acidity recommended for plain yoghurts (Joel et al., 2014; Eke et al., 2013).
Microbial Analysis
The examined microbial include: Total microbial load (viable counts) (TVC) and potential pathogen bacteria, Figure 6. Total coliform results showed that the content for all the treatment groups decreased non-significantly (p<0.05) for all the experimental groups compared to the control D (5.4 x 10⁶) with the exception of 100% okpa yoghurt treated with commercial culture A2, (6.5 x 10⁵) and 50% akidi + fiofio yoghurt treated with sorghum and millet steep water E3 (7.2 x 10⁵) G3 (5.6 x 10⁶) that recorded non-significantly (p<0.05) higher than the control D (5.4 x 10⁶). The analysis further revealed that the total viable counts (TVC) of the microbiological analysis contains 1.0 x 10⁶, 6.5 x 10⁵, 2.8 x 10⁶, 2.4 x 10⁶, 1.2 x 10⁶, 2.0 x 106,1.8 x 106, 3.4 x 10⁶, 1.0 x 10⁶, 1.2 x 10⁶, 2.0 x 10⁶, 3.3 x 10⁵, 5.4 x 10⁶, 4.4 x 10⁵, 2.1 x 10⁶, 7.2 x 10⁵, 2.8 x 10⁶, 1.0 x 10⁵, 4.0 x 10⁶, 3.2 x 10⁶, 4.8 x 10⁶ and 5.6 x 10⁶ for all the groups ((A1, 2, 3, 4, to G1, 2, 3,) respectively in colony forming unit (cfu/ml) which is in agreement with Nigeria National Industrial Standard for yoghurt (NIS337:2004). Also, the study of Farinde et al., in 2009 reported that the standard yoghurt bacterial load range should be < (1x10⁶cfu/g).

Figure 6. Microbial analysis of Yoghurts fermented with commercial starter, sorghum and millet steep water.
Sample A: yoghurt fermented with regular culture, Sample B: yoghurt fermented with sorghum culture, Sample C: yoghurt fermented with millet culture, Sample D: commercial hollandia yoghurt as control, Sample E: varied yoghurt fermented with regular culture, Sample F: varied yoghurt fermented with sorghum culture and Sample G: varied yoghurt fermented with millet culture.
Total coliform and Escherichia coli, (Pathogenic bacteria) were absent in all the yoghurt samples, suggesting that the yoghurts were safe and suitable for consumption (NIS337:2004). However, there were an unsteady rise of yeast/mould observed from yoghurts of okpa yoghurt treated with commercial culture (A2) and mixture of akidi + fiofio yoghurt treated with sorghum (E3) that recorded non-significantly (p<0.05) higher than the control (D). (6.5 x 10⁵cfu/ml and 7.2 x 10⁵cfu/ml respectively) which is in conformity with the report of (Abrar et al., 2009). Interestingly, all the yoghurts recorded values within the normal range (6.33cfu/ml and 10.33cfu/ml) (NIS337, 2004) of Nigeria Industrial Standard, (2004), Egyptian yoghurt Standards (EOSQC), (2005) Turkish Standard Institute (1989) and National Yoghurt Association, (2013b) all stated that a maximum count of 10cfu/ml of coliform group bacterial is acceptable in yoghurt. Hence, in this study, the samples with the values less than or equal to 10cfu/ml are therefore justified suitable and safe for consumption. Absence of Escherichia coli and coliforms as reported will extend the shelf-life of the products (Weerrathilake, 2014).
Sensory Scores of Yoghurts
Aroma, appearance, taste, texture, and overall acceptance Figure 7, were the sensory qualities evaluated. The statistical analysis revealed that there were significant differences (p<0.05) among the yoghurt samples in the sensory attributes observed. Sample A1 (100% cowbell yoghurt fermented with regular starter culture) had the highest score (8.3) higher, while sample F1, 2,3 and G1, 2, 3 (50% okpa + akidi, okpa +fiofio and akidi + fiofio yoghurts treated with sorghum and millet steep water) had the lowest score range (1 to 1.2 %)lower in Aroma as compared with control yoghurt D (8.0%).

Figure 7. Sensory Scores of Yoghurts fermented with commercial starter, sorghum and millet steep water.
Sample A: yoghurt fermented with regular culture, Sample B: yoghurt fermented with sorghum culture, Sample C: yoghurt fermented with millet culture, Sample D: commercial hollandia yoghurt as control, Sample E: varied yoghurt fermented with regular culture, Sample F: varied yoghurt fermented with sorghum culture and Sample G: varied yoghurt fermented with millet culture.
In Appearance, sample A1 (100% cowbell yoghurt fermented with regular starter culture) had the highest score (8.8) higher, while sample F1, 2,3 and G1, 2, 3 (50% okpa + akidi, okpa +fiofio and akidi + fiofio yoghurts treated with sorghum and millet steep water) had the lowest score range (4.1 to 4.3 %) lower as compared with control yoghurt D (8.3%).
The result also revealed that in the yoghurt taste, sample A1 (100% cowbell yoghurt fermented with regular starter culture) had the highest score (8.0) higher, while sample F1, 2,3 and G1, 2, 3 (50% okpa + akidi, okpa +fiofio and akidi + fiofio yoghurts treated with sorghum and millet steep water) had the lowest score range (1 to 1.1 %)lower as compared with control yoghurt D (7.7%).
However, in texture, Sample A1 (100% cowbell yoghurt fermented with regular starter culture) had the highest score (7.0) but lower, while sample F1, 2,3 and G1, 2, 3 (50% okpa + akidi, okpa +fiofio and akidi + fiofio yoghurts treated with sorghum and millet steep water) had the lowest score range (1 to 1.1 %) much lower as compared with control yoghurt D (8.0%). It is important to say that: the texture of fermented dairy products is highly associated with composition of the milk, heat treatment, starter culture used, and acidification rate as well as storage conditions Tugba (2022). Therefore, textural necessity can be difficult to achieve, especially in low-fat and fat-free products.
Finally, in overall acceptance, also sample A1 (100% cowbell yoghurt fermented with regular starter culture) had the highest score (8.7) equal to, while sample E1,2, F1, 2,3 and G1, 2, 3 (50% okpa + akidi, okpa +fiofio and akidi + fiofio yoghurts treated with sorghum and millet steep water) had the lowest score range (1.0 to 1.4%) lower as compared with control yoghurt D (8.7%). The overall results showed that the sensory evaluation response of participants with regard to all the yoghurts were absolutely in relation to the fortification of animal sourced milk (cowbell) and addition of additives to the control yoghurt D (Hollandia plain yoghurt). The five parameters evaluated were observed to be significantly increased or equal to and to an extent nonsignificant differ in both the yoghurts fermented with the regular starter culture and sorghum and millet steep water with appreciable values been recorded in 100% yoghurts such as on average of 4.0minimun to 8.0maximun across all the parameters evaluated. Interestingly, a similar analysis has been reported by Nath et al. (2020), and also by Ryan et al., 2020 where mango enriched yoghurt showed overall improvement in sensory scores.
The study has presented 22 yoghurts formulations and blends combining with 2 selected potential cultures: sorghum and millet that possess the Lactobacillus bugaricus and Streptococcus thermophilus as alternative to commercial starter culture for yoghurt fermentation. The obtained results from all the formulations and control yoghurt, demonstrated that the production of yoghurt from plants raw materials and or integration of plant extracts from Okpa, akidi oji and fiofio is feasible and viable. Also, from the study was seen the feasibility of sorghum and millet steep water having the potential to ferment milk for yoghurt production. However, there is need for further research on eliminating beany flavour and unhealthy aroma associated grains and cereals used in the yoghurt production, as unwholesome aroma could discourage yoghurt producers from using the local culture, for the fear of their product being rejected by the consumers. The mean proportional level of proteins, carbohydrates, phytochemicals, vitamins and minerals present in all the yoghurt samples are nutritionally significant in terms of the potentials of these yoghurts to contribute to the dietary balanced for dairy consumers. The results obtained from mineral and vitamins contents also justifies the assertion that yoghurt is a very good source of essential minerals needed for human metabolism or functionality of cells, and are also important source of vitamins for nutritional components required for the normal functioning of the human body. Furthermore, the absence of Escherichia coli and coliforms as reported will extend the shelf-life of the products. However, the result further revealed that the animal sourced yoghurt recorded the highest overall preference base on the sensory evaluation scores compared to the three plant-based yoghurts 100% (akidi, okpa, fiofio) and their 50% combinations. With this satisfactory results obtained from yoghurt produced from local plant raw materials, it is therefore, advised that individuals should welcome, use and promote yoghurts, beverages and other foods made from full or blends of Cajanus cajan (Fiofio), Vignia ungiculata (Akidi oji) and Vignia subterranea (Okpa).
Abrar M, Anjum FR, Zahoor T, Rahman SU, Hussain S, et al. (2009). Chemical and sensory characteristics of yoghurt prepared by locally isolated and commercially imported starter cultures. Milchwissen schaft. 64: 392-395.
Adriana D, Georgiana GC, Anca-Mihaela G & Lăcrămioara R (2018). Quality assessment of yogurt enriched with different types of fibers, CyTA - J Food. 16: 859-867.
Indexed at, Google Scholar, Cross Ref
Anderson JJB, Adlercreutz H, Barnes S, Bennink MR (2000). Appropriate isoflavone food fortification levels: results of a consensus conference. Exp. Biol. 15-18.
AOAC (2010). Official Methods of Analysis. Association of Official Analytical Chemists. 18th edition, Washington D.C.
Belewu MA, Belewu KY & Bamidele RA (2010). Cyper-coconut yoghurt: Preparation, compositional and organoleptic qualities. AJFST. 1: 010-012.
Crispín-Isidro G, Lobato-Calleros C, Espinosa-Andrews H, AlvarezRamirez J, & Vernon-Carter EJ (2015). Effect of inulin and agave fructans addition on the rheological, microstructural and sensory properties of reduced-fat stirred yogurt. JFST. 62: 438-444.
Indexed at, Google Scholar, Cross Ref
Desouky (2018). Effect of using cactus pear pulp on the properties of goats’ milk bio yoghurt drinks. Egypt J Food Sci. 46: 25-41.
Egyptian Standards (EOSQC), 2005. Milk and milk products. EOS, ES: Yoghurt 1633.
Eke MO, Olaitan NI & Sule HI (2013). Nutritional evaluation of yoghurt-like product from baobab (Adansonia digitata) fruit pulp emulsion and the micronutrient content of baobab leaves. Adv J Food Sci Technol. 5: 1266-1270.
FDA (2013). Yogurt. 21 CFR 131.200, Code of Federal Regulations. U.S. Dept. of Health and Human Services, Washington, DC.
FDA (2011). Grade A pasteurized milk ordinance, US Department of Health and Human Services, Public Health Service, Food and Drug Administration: New Hampshire.
Fox PF, McSweeney PLH (1998). Dairy chemistry and biochemistry. London: Thomson science.
Indexed at, Google Scholar, Cross Ref
Hutkins RW (2006). Microbiology and technology of fermented foods. Blackwell publishing. 1-3.
Indexed at, Google Scholar, Cross Ref
Ihemeje A, Nwachukwu CN. & Ekwe CC (2015). Production and quality evaluation of flavoured yoghurts using carrot, pineapple and spiced yoghurt using ginger and pepper fruit. Afr J Food Sci. 9: 163-169.
Jakkutowicz k, Tomick ZI & Leokadia L (1977). Determination of total plasma tocopherol in the presence of carotenes, Pol Arc Water. 20: 45-57
Joel N, Felicia I & Rabiu G (2014). Production and quality assessment of functional yoghurt enriched with coconut. Int J Food Sci Nutr. 3: 545-550.
Khalifa M, Elgasim A, Zaghloul A, & Maufouz M (2011). Application of inulin and mucilage as stabilizers in yoghurt production. Am J Food Technol. 1: 10- 17.
Mbaeyi-Nwaoha IE, Umeh LC, Igbokwe CJ, Obodoechi CM, & Okoronkwo NC (2017). Production and quality evaluation of flavoured yoghurt from graded levels of sweet variety of african bush mango “Ugiri” (Irvingiagabonensis) juice and pulp. Food Sci Technol.5: 56-69.
Muehlhoff E, Bennett A, McMahon D (2013). Milk and dairy products in human nutrition. FAO.
Nath M, Tasnim A, Chowdhury JKH, Alam F, & Absar N (2020). Comprehensive evaluation of physicochemical characteristics and sensory acceptance of selected fruits, almond and dark chocolate incorporated yoghurt.
National Yogurt Association (2013a). Yogurt varieties.
National Yogurt Association, (2013b). Yogurt wholesome food for everybody.
Obidoa O, Joshua PE. & Eze NJ (2010). J Pharm Res. 3: 280-286.
ODPHP (2016) Office of Disease Prevention and Health Promotion. Dietary Guidelines for Americans 2015 -2020 - Cut Down on Saturated Fats, 8 editions. 1-2.
Ogundele OM, Falade KO, Ogunshe AO (2015) Physico-chemical, sensory and microbiological characteristics of plain yoghurt from bambara groundnut (Vigna subterranea) and soybeans (Glycine max). J Food Sci Technol. 52: 5858-5865.
Indexed at, Google Scholar, Cross Ref
Okereke HC.& Anukam U (2015). The microbial changes of fermenting cowpea seeds into a novel food condiment (agwaure) at varying temperatures and ph. Asian J Appl Sci. 4: 62-70.
Okonkwo CJ, Udensi EA, Okereke IC, & Nwachukwu NO (2017). Physicochemical characteristics and anti-nutritional factors of fermented complementary food based on maize pigeon pea flour. J Adv Food Sci Technol. 4: 38-43.
Okonkwo CU, Udensi EA, Okereke HC, & Ndubuisi NO (2016). Amino acid profile and growth promoting response of fermented and germinated complementary foods based on maize and pigeon pea flour. Int j innov dev. 5: 192-199.
Olakunle Moses Makanjuola (2012). Chemical analysis of flesh and some body parts of different fresh fish in south west nigeria. Pak J Nutr. 11: 14-15.
Indexed at, Google Scholar, Cross Ref
Osagie AU (1998). Post-Harvest Research Unit, Benin City, Nigeria, 221-244.
Pearson DA (1976). The chemical analysis of foods (7th edition) Churchill and Living Stone, Edinburgh, London 355 – 356.
Raju NP & Pal D (2014). Effect of dietary fibers on physico-chemical, sensory and textural properties of Misti Dahi. J Food Sci Technol. 51: 3124-3133.
Indexed at, Google Scholar, Cross Ref
Ryan J, Hutchings SC, Fang Z, Bandara N, Gamlath S, et al. (2020). Microbial physico-chemical and sensory and characteristics of mango juice-enriched probiotic dairy drinks. Int J Dairy Technol. 73: 182-190.
Indexed at, Google Scholar, Cross Ref
Sanful RE (2009). Promotion of coconut in the production of yoghurt. Afr J Food Sci. 3: 147-149.
Shi J, Han YP, & Zhao XH (2017). Quality attributes of set-style skimmed yoghurt affected by the addition of a cross-linked bovine gelatin. CyTA - J Food. 15: 320-325.
Indexed at, Google Scholar, Cross Ref
Stringer M (2000). Chilled Foods. A comprehensive guide, 2 ed., Wood Head publishing limited, Cambridge England. 162-168. The Dairy Council, 2013. The Nutritional Composition of Dairy Products. London.
Thompson LU (1993). Food Res Int. 26: 131-149.
Tolo R, Suarez A & Clemente MG (2014). Intestinal Microbiota in health and disease: Role of bifid bacteria in gut homeostasis. World J Gastroenterol. 20: 15163-15176.
Indexed at, Google Scholar, Cross Ref
Tugba A. (2022). Physicochemical and sensory characterisation of different yoghurt production methods. Int Dairy J 125: 105245
Udeozor LO (2012). Tiger nut-soymilk drink: Preparation, proximate composition and sensory qualities. Int J Food & Nutr Sci. 1: 18-26.
Ugbogu OC, Onyeagba RA, Okereke HC (2017). Effect of lactic acid bacteria consortium fermentation on the pro\imate composition and in-vitro starch/protein digestibility of maize (Zea mays) flour. J Microbiol Biotechnol. 4: 38-43.
United Kingdom Food Standards Agency (2011). Dairy Products. Foodstuffs made from mammalian milk.
United State Department of Agriculture (2016). National Agricultural Statistics Service.
Weerrathilake WADV, Rasika DMD, Ruwanmaali JKU, & MUnasinghe MADD (2014) The evolution, processing, varieties and health benefits of yoghurts. IJSRP. 4: 1-10.
Zhi NN, Zong K, Thakur K, Qu J, Shi JJ, et al. (2018). Development of a dynamic prediction model for shelf-life evaluation of yogurt by using physicochemical, microbiological and sensory parameters. CYTA-J Food. 16: 42-49.
Indexed at, Google Scholar, Cross Ref
Citation: Udensi et al., (2023). Quality assessments of yoghurts produced from local plant raw materials {cajanus cajan (fiofio), vignia ungiculata (akidi oji) and vignia subterranean(okpa)}. AJFST. 14: 006.