Research Article - African Journal of Food Science and Technology ( 2025) Volume 16, Issue 1
Received: 16-Jun-2024, Manuscript No. AJFST-24-139143; Editor assigned: 18-Jun-2024, Pre QC No. AJFST-24-139143 (PQ); Reviewed: 02-Jul-2024, QC No. AJFST-24-139143; Revised: 08-Jan-2025, Manuscript No. AJFST-24-139143 (R); Published: 15-Jan-2025
Milk is a valuable yet perishable food commodity. The effect of different freezing duration (24, 48, 72, and 96 hours) on the physicochemical characteristics and microbiological quality of milk and yoghurt was examined in this study. Extending the freezing durations of milk resulted in a significant decrease in the number of aerobic plates, indicating its efficacy in microbial control. Likewise, the pH, fat content, and protein content of the milk decreased, possibly because of destabilized fat globules and residual enzymatic activity. Contrary, the yoghurt quality was barely affected. While acidity decreased slightly, pH, fat and protein contents of the yoghurt remained basically the same during the freezing treatment. These findings suggest that freezing offers a viable option for short-term preservation of cow milk to control microbial growth while maintaining the quality of resultant yoghurt. Further research is recommended to explore the effects of longer freezing times as opposed to cost on fresh milk preservation and quality of yoghurt.
Milk and milk products have been an integral part of food systems for the sustenance and nutrition of humans since existence (Aboagye GS, 2002). In Ghana, milk produced and consumed usually comes from cattle of indigenous breeds like the Sanga, or Sokoto Gudali and sometimes from exotic breeds (Jersey and Friesian) or a crossbreed of the indigenous and exotic breeds like Friesian-Sanga (Abranches AD, et al., 2014). Fresh milk, produced mainly as a byproduct of meat production, is mostly used to feed the calf and the excess for home consumption or sold (Achaglinkame MA, et al., 2023). The milking process is mostly performed by Fulani who rear their cattle or herd the cattle for other people thereby using milk as a form of payment for the herder or as an exclusive payment (Ahmad T, et al., 2019). Milk secreted by a local breed yield between 0.5 to 3 litres per day as compared to the exotic and crossbreed which produces about 7 to 14 litres of milk in a day (Aidoo R, et al., 2009).
Milk which contains macronutrients like fats, carbohydrates (lactose) and proteins, and essential micronutrients like calcium, potassium, phosphorus, zinc, magnesium, and vitamins is highly perishable (Ajmal M, et al., 2018). It therefore requires instant preservation such as refrigeration between 0°C to 4°C, and/or process into less perishable forms like cheese, butter, milk powder and yoghurt (Alrabadi NI, 2015). With about 80% water composition, milk can last for about two (2) hours under ambient conditions due to its susceptibility to spoilage (Anema SG, 2020).
The spoilage usually occurs due to unsafe practices like improper cleaning and sanitizing of the udder before milking, use of unsterilized containers for storage, and unhygienic working environment (Arefin S, et al., 2017). Most of the milk produced in developing countries like Ghana is sold unpasteurized in the informal marketplaces, thereby decreasing the milk's shelf life (Bittante G, et al., 2022). The stakeholders in the value chain have considered freezing as an alternate perseverative technique to prevent spoiling, increase the shelf life, and maintain the nutritional value of the milk (Caroli AM, et al., 2009). Freezing of milk preserves the nutritional content, prevents spoilage, and extends the shelf life as compared to other chemical-based preservation methods (Chipurura B, et al., 2014). However, the freezing process can impact the physicochemical and sensory characteristics of raw milk and its products including yoghurt. This can potentially alter consumer acceptability and marketability of milk products (Dortey MD, et al., 2020). Although there has been research on how the freezing cycle influences the quality of sheep milk by inhibiting the growth of microorganisms due to temperature reduction thereby slowing down enzymatic and microbial activities, in human milk, freezing is efficient for controlling microbial activities thereby helps in preservation of milk quality during storage and even Yak milk and its yoghurt attributes, only limited data has been reported on freezing dynamics on quality of fresh cow milk and its products (Gartner LM, et al., 2005). There is, therefore, the need to evaluate the effect of different freezing times on the properties of the fresh milk and ensuant yoghurt produced from the freeze-thawed milk (Gaucheron F, 2011). Investigating the freezing cycle effect on raw milk and yoghurt is essential for optimizing freezing protocols and ensuring product consistency and consumer satisfaction (Gidiglo KF, 2014).
Materials
Fresh cow milk was obtained from Yarasoo dairy farm located on Livestock and Poultry Research Centre (LIPREC) and the starter culture, containing Lactobacillus bulgaricus, Streptococcus thermophilus, and Lactobacillus acidophilus, from the Dairy Unit of LIPREC, University of Ghana, Legon (Gorska-Warsewicz H, et al., 2019).
Experimental design
The study was carried out under two quality perspectives: Physicochemical, and microbiological (Maida AL, et al., 2023). The physicochemical tests were done on both the fresh milk and yoghurt samples to check the variability in pH, specific gravity (for milk alone), titratable acidity, protein, and fat contents. To monitor the microbial quality, the samples were analyzed for total plate count, and Enterobacteriaceae.
Sample collection
Collection of milk was done in the morning (7 am) prior to feeding. Milk (10 L) was collected aseptically into a sterile container and immediately placed in an ice chest with ice packs and transported to the Dairy facility of LIPREC for chilling at 4°C for 24 hrs. 500 ml of the milk was sampled for milk quality and composition after chilling and 1.5 L was used to produce yoghurt following the yoghurt process used at the Dairy Unit of LIPREC (Musa ZA et al., 2013). The quality analysis of yoghurt was carried out after chilling to 4°C for 24 hrs (Musembei LM, et al., 2021). Milk was distributed into a 1 litre sterile containers, two for each freezing at -20°C ± 1°C for 24 hrs, 48 hrs, 72 hrs and 96 hrs. These freezing durations align with typical storage scenarios encountered in both domestic and industrial settings. Consumers often freeze milk or yogurt for short to moderate periods (e.g., 24-48 hours) to preserve freshness or extend shelf life. Similarly, food manufacturers may freeze dairy products for longer durations (e.g., 72-96 hours) as part of their production and distribution processes.
For each freezing time all samples were brought out to thaw in a water bath at 25°C for 40 min and manually homogenized by shaking for 30s prior to analysis for each given freezing time. Yoghurt was produced for each sample after thawing at each given time frame (Figures 1,2).

Figure 1. Experimental design.
Yoghurt processing

Figure 2. Yoghurt process flow (Adapted from LIPREC-dairy unit, UG-legon).
Physicochemical analysis
Some physicochemical indices were selected and monitored during the period of the study. For each freezing time of milk and its corresponding yoghurt made these analyses were performed (Table 1).
| Milk samples | Yoghurt samples |
| pH | pH |
| Titratable acidity | Titratable acidity |
| Specific gravity | Fat |
| Fat | Protein |
| Protein |
Table 1. List of physicochemical analyses carried out.
All samples were thawed to about 18 ± 2°C before test analysis was run within 24 hours and measured in triplicates.
pH analysis
pH of each sample was read using an OHAUS St20 Pen Meter (pH/ORP/COND./TDS/Salinity OHAUS instruments). 50 ml of each sample was transferred into a 150 ml measuring cup. The probe of the pH meter was sterilized in warm water and immersed into the cup containing the sample and the pH values were read in triplicates. The average pH values were calculated and used
%Titratable Acidity (TTA)
Milk and yogurt samples were titrated with 0.1 N NaOH to assess their titratable acidity. An indicator, 0.5% phenolphthalein, was used to measure the titratable acidity of the samples until a light pink colour was reached. The percentage lactic acid was determined thus:
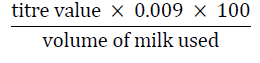
TTA measurement was taken in triplicates with the average TTA values used for interpretation.
Specific Gravity (S.G)
The milk sample was heated to 20°C and held for 5 minutes, to solubilize fat in the milk. The milk was mixed thoroughly but gently avoiding air bubbles accumulation. The milk was filled into a 100 ml glass measuring cylinder to the 70 ml mark. Holding by the tip, the lactometer was lowered gently into the milk sample avoiding it sticking to the walls of the measuring cylinder. The reading was obtained from the top of the meniscus after the lactometer was left to float freely until it achieved equilibrium. The process was run in triplicate, and the interpretation was based on the mean S.G. results.
Protein-Pyne method
Five drops of phenolphthalein indicator were added to a 100 ml flask containing 10 ml of the milk sample and 10 g of yoghurt that had been dissolved in 50 ml of distilled water. Saturated potassium oxalate (0.4 ml) was then added, and the mixture was left undisturbed for two to four minutes. A pink end point was reached by titrating milk against the standard alkali (N/10 NaOH). Following the addition and mixing of 2 ml of neutral formalin, the mixture was titrated to the same pink end point as before using N/10 NaOH as the reference alkali. Recorded was the Volume (V) of alkali utilized in the second titration. Calculation: %Protein in the given sample of milk=V × 1.7
Fat-Rose Gottlieb method
The procedure involved weighing an empty flask, measuring ten grams of milk, and then transferring the milk into an extraction tube. After adding 2 milliliters of ammonia, the liquid was well mixed. 25 milliliters of peroxide-free diethyl ether were added, and the mixture was violently agitated for approximately a minute before adding 10 milliliters of ethyl alcohol and mixing once more. 25 ml more of petroleum ether was added, and after shaking for around 30 seconds, the mixture was allowed to settle until the top ethereal layer was visible. Then, the previously weighted flask was filled with this transparent, ethereal layer. The flask was then filled with 15 ml of peroxide-free diethyl ether and 15 ml of petroleum ether, each of which was added after a vigorous shake and a period to settle until the upper ethereal layer became transparent. A tiny amount of ether was used to rinse the extraction tube's delivery end before adding it to the flask. The contents of the flask were evaporated and then heated to 105°C in an air oven for thirty minutes. After cooling in a desiccator, the contents were weighed one more time.
Calculations:
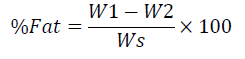
Where W1: Weight of flask with fat
W2: Weight of empty flask
WS: Weight of sample only
Microbial analyses
Yoghurt and milk samples were examined for Enterobacteriaceae and total plate count. After aseptically weighing 10 g of the material into sterile stomacher bags, 90 ml of peptone water was added, and the sample was homogenized by blending with a Stomacher blender. 1 ml aliquots of the mixture were pipetted aseptically into sterile disposable petri dishes in duplicates, 15 ml of the molten agar (plate count agar for the total plate count and violet red bile glucose agar for the Enterobacteriaceae) was added and swirled, and the plates were allowed to solidify and incubated at 37°C. The plates were examined after incubation and colonies counted.
Statistical analyses
Data from the physicochemical and microbiological analyses were analyzed using Minitab software version 21.4.1. One-way ANOVA was employed to assess potential variations among the milk and yogurt samples, Tukey’s HSD post hoc analysis was conducted to elucidate any differences observed among the samples at a significance level of 5%.
Influence of freezing duration on milk composition and yoghurt quality
Effects of different freezing durations on the physiochemical of milk were assessed and presented in Table 1. The Aerobic Plate Count (APC) and Total Coliform Count (TCC) were also determined (Table 2).
| Parameters | Samples/freezing time (hrs.) | ||||
| M/Control | M/FT-24 | M/FT-48 | M/FT-72 | M/FT-96 | |
| pH | 6.167 ± 0.058a | 6.133 ± 0.058a | 6.00 ± 0.100ab | 5.867 ± 0.058bc | 5.700 ± 0.100c |
| TTA | 0.361 ± 0.002d | 0.346 ± 0.002d | 0.525 ± 0.008b | 0.563 ± 0.010a | 0.465 ± 0.007c |
| S.G | 1.028 ± 0.001b | 1.029 ± 0.001b | 1.031 ± 0.001a | 1.032 ± 0.000a | 1.031 ± 0.002a |
| Fat | 3.523 ± 0.096a | 3.287 ± 0.142ab | 2.950 ± 0.115bc | 2.567 ± 0.162cd | 2.420 ± 0.191d |
| Protein | 3.077 ± 0.045a | 2.810 ± 0.036ab | 2.667 ± 0.189bc | 2.590 ± 0.171bc | 2.397 ± 0.182c |
| APC | 6.473 ± 0.082a | 4.980 ± 0.190c | 5.414 ± 0.047bc | 5.584 ± 0.111b | 5.716 ± 0.088b |
| TCC | 0 | 0 | 0 | 0 | 0 |
Table 2. Quality properties of fresh milk frozen at different times.
Data for freezing time is presented as mean ± SD, Values in a row with different alphabets are statistically different for each parameter at p<0.05. Abbreviations: TTA: Titratable acidity; S.G: Specific Gravity; APC: Aerobic Plate count; TCC: Total Coliform Count.
The microbial status of the frozen milk samples is included in Table 1. The Aerobic plate count results showed a statistically significant difference across the freezing times, and the microbial counts generally decreased with an increase in the freezing duration. Enterobacteriaceae or Total Coliform Count (TCC) however was not detected in all the samples. Walstra stated that after 4–5 days following the initial milking, raw milk without heat treatment maintained at 4°C will have a bacterial count of more than 5 x 10⁵ cells/ml. This is thought to be the ideal processing upper limit. Alrabadi, also recorded similar results in his research and suggested freezing as a useful method of milk preservation to manage the rise in bacterial counts.
Protein
From Table 1, there is a statistical significance between the control and milk at FT-96, between FT-24 and FT-96 but no significance between FT-48 and FT-72. Also, it can be observed that there is a consistent decrease in milk protein as the freezing time for the milk samples increases. This agrees with a study by Kehoe, et al., which found that freezing and thawing over different periods can initiate enzymatic and non-enzymatic proteolytic processes, resulting in the breakdown of proteins into smaller peptides and amino acids. This degradation can reduce the overall protein content of the milk. Additionally, this finding is confirmed in a study by Malmgren, et al., where they investigated the effects of freezing on the physicochemical properties of milk proteins. They found that freezing and thawing led to changes in the secondary and tertiary structures of proteins, affecting their content and hence their functional properties. Other research has shown that freezing and thawing can result in a decrease in the solubility and stability of proteins in milk. Another study by Zajac, et al., reported a 13.6% decrease in protein content when cow milk was frozen and thawed, this was as a result of potential alterations in protein structure and solubility (Figure 3).

Figure 3. Protein and milk contents across different freezing time.
Figure 3 shows a decrease in the protein content as the freezing time increases. This finding is confirmed by other studies.
pH and acidity of milk
There were statistically significant differences in pH between the control, 24-hour, and the three other frozen samples. As per literature, slow freezing decreases the pH of milk to as low as 5.7-5.8 as it was seen in the freezing time of 72 and 96 hours whereas the pH of the control, 24 and 48 hours had pH readings like findings in Van Den Berg. The likelihood of lactic acid fermentation occurring during the storage process and causing the pH to drop while the milk was in storage exists because microbial activities persist even at -20°C.
Specific gravity and fat content of milk
According to Table 1, the length of the frozen period has a minor impact on the specific gravity. Milk's specific gravity, according to Tamime, ranges from 1.027 to 1.035 g/ml, with a mean of 1.032 g/ml. The outcome of this current research falls within the range. There were no statistically significant differences in the fat content between the control and freezing time 24 and between freezing time 24 and freezing time 48. However, there was a statistical significance between the control, FT-24 and FT-72 and FT-96.This affirms that the longer the freezing time the moredifferences you observe in the fat composition of milk. Thisfinding agrees with studies by Creamer et al. They foundthat the freezing and thawing of milk over a relativelylonger period can lead to the partial coalescence of fatglobules, altering the fat network structure, reducing thefat content, and thereby affecting the sensory properties of the milk. Farkye also states that rapid thawing and freezingof milk can cause partial melting of the fat globulemembrane which leads to increased fat loss. Similar resultswere also reported by Rico, et al., and Zajac, et al., in theirstudy in cattle milk. They found that cattle milk frozen andthawed for over 72 and 96 hours had a decreasing fatcontent as the period of freezing increased (Figure 4 &Table 2).

Figure 4. Fat content at different freezing times.
| Physicochemical parameters | Samples/freezing time (hrs.) | ||||
| Y/Control | Y/FT-24 | Y/FT-48 | Y/FT-72 | Y/FT-96 | |
| pH | 4.167 ± 0.058a | 4.133 ± 0.058a | 4.133 ± 0.058a | 4.133 ± 0.058a | 4.167 ± 0.058a |
| TTA | 1.448 ± 0.004a | 1.441 ± 0.003a | 1.393 ± 0.057b | 1.272 ± 0.010c | 1.129 ± 0.002d |
| Fat | 2.693 ± 0.215c | 2.960 ± 0.082bc | 3.157 ± 0.040ab | 3.230 ± 0.050ab | 3.297 ± 0.076a |
| Protein | 2.807 ± 0.074a | 2.687 ± 0.168a | 2.630 ± 0.036a | 2.610 ± 0.265a | 2.477 ± 0.145a |
| Aerobic plate count | 5.601 ± 0.046a | 5.511 ± 0.028a | 5.416 ± 0.163a | 5.286 ± 0.347a | 5.484 ± 0.010a |
| Enterobacteriaceae | 4.452 ± 0.213c | 0d | 5.243 ± 0.018b | 5.875 ± 0.024a | 5.701 ± 0.067a |
| Data for freezing time is presented as mean ± SD, values in a row with different alphabets are statistically different for each parameter at p<0.05. Abbreviations: TTA: Titratable Acidity; APC: Aerobic Plate count; TCC: Total Coliform Count | |||||
Table 3. Quality properties of yoghurt frozen at different times.
Yoghurt microbiological analyses
Aerobic plate count results in Table 2 showed that there was no statistically significant difference across the freezing times, although it decreased with an increase in the freezing period. Total Coliform Count (TCC) however showed a statistically significant difference in the yoghurt during freezing. Yoghurt containing Enterobacteriaceae shows a sign of inadequate sanitation and potential enteric pathogen contamination. The study showed that high levels of TCC was recorded in the 48 to 96hrs of the yoghurt samples indicating possible contamination during the processing.
pH and acidity of yoghurt
There was no statistical significance between any of the samples across the different freezing times (Table 2). The pH across the times remained the same. This is like literature by Speranza, et al., who found that over a short period of freezing thaw cycle, yoghurt undergoes minimal changes in pH. This is because the bacteria present in the yogurt culture are essentially dormant during freezing which means their metabolic activity which includes acid production is halted. This leads to a relatively stable pH. The acidity (TTA) for the control and freezing time 24 are the same, however, acidity slowly decreases across freezing times 48, 72 and 96 hrs (Figure 5).

Figure 5. TTA and yoghurt across different freezing times.
Protein
According to Table 2 and Figure 4, there were no statistical differences observed between any of the samples across the different freezing times. This data also suggests that the freezing did not have any significant impact on the nature of the proteins within the yoghurt. This observation is similar to a study by Sodini, et al., where they examined the effects of different freezing temperatures and times on the properties of yoghurt. They found that freezing times less than a week resulted in better retention of the yoghurt quality, including the protein structure. A study by Ozkan and Floros which investigated the impact of freezing on physicochemical properties found that protein decreases in solubility and increased syneresis, indicating protein aggregation and structural changes only when the freezing time exceeds 120 hours. This finding is also consistent with the current study that no significant difference exists in protein content during the freezing duration. In a separate study by Saberi, et al., they concluded that both freezing and thawing can impact the protein content and structure of yoghurt, however, short freezing and thawing methods are generally expected to minimize protein degradation and maintain protein yoghurt quality (Figure 6).

Figure 6. Protein of yoghurt across different freezing times
Fat content of yoghurt
The fat contents of the control and FT-24 are the same but increased slightly at FT-48 and remained steady between FT-48, FT-72, and FT-96 (Figure 5). Statistically, there was a difference between the control and FT-96. This agrees with McBreen, et al., whose study suggests that prolonged freezing and thawing may lead to fat separation which may be the case at FT-96 albeit small. This separation however is likely to be related to textural change rather than a loss of fat. Studies by Schade, suggest that fat content overall remains relatively stable after freezing and thawing. It further states that the milk fat globules that contain the fat are surrounded by a membrane that protects them from significant breakdown during the process. This confirms the almost steady fat content of the sample from the control freezing time to FT-96 (Figure 7).

Figure 7. Fat and yoghurt across different freezing times.
This study examined how freezing times affected the quality attributes of yoghurt and milk. The results indicate that freezing can largely alter milk composition compared to yoghurt quality. Bacterial counts in milk were significantly reduced by freezing. The pH of milk decreased with longer freezing durations, probably because of the residual enzyme activity. Long-period freezing reduced the fat content, possibly because of the destabilization of fat globules. Longer freezing durations also resulted in a drop in protein concentration, which may have been due to both enzymatic and non-enzymatic breakdowns. Because yoghurt cultures are dormant, freezing had no effect on yoghurt pH over the study period. Longer freezing durations for yoghurt resulted in a small decrease in acidity. The protein level of the yoghurt did not significantly change during the various freezing times. Even after prolonged freezing, yoghurt's fat content stayed largely constant. These results imply that freezing milk can be an effective way to preserve it for a short duration while preventing microbial growth. Extended freezing periods, however, may have a deleterious effect on the composition of milk. On the other hand, the freezing technique seems to have less impact on the quality of the resultant yoghurt, suggesting that freezing could be a viable solution for the preservation of fresh milk intended for yoghurt production without compromising its quality.
[Crossref] [Google Scholar] [PubMed]
[Crossref] [Google Scholar] [PubMed]
[Crossref] [Google Scholar] [PubMed]
[Crossref ] [Google Scholar] [PubMed]
[Crossref] [Google Scholar] [PubMed]
[Crossref] [Google Scholar] [PubMed]
[Crossref] [Google Scholar] [PubMed]
[Crossref] [Google Scholar] [PubMed]
Citation: Afizie, Mensah (2025). Influence of Freezing Duration on Quality Characteristics of Fresh Cow Milk and Yoghurt. AJFST. 16:01.