Research Article - Journal of Research in Environmental Science and Toxicology ( 2021) Volume 10, Issue 5
Received: 05-Nov-2021 Published: 26-Nov-2021
Textile and dyes industries are generating huge amount of dye wastewater which are toxic and hazardous to the environment. Activated charcoal based adsorption is economical treatment of waste water and water purification. It offers an effective method for removal of organic compounds and colour from wastewater at low cost. The present work is focused on the removal of Reactive Red 195 dye using activated charcoal. The percentage removal of dye is strongly dependent on the input parameters like time of agitation, temperature of system, amount of charcoal added and initial concentration of dye. A statistical technique response surface methodology was employed to study the influence of various input parameters on percentage of dye removal. Three-factor-three-level Box-Behnken Design was used for design of experiments. Freundlich and Langmuir isotherms were fitted well for the described process. Gibbs free energy was also evaluated which was -3.051 KJ/mol at 30°C. This negative value shows the feasibility of the adsorption process. Lagergren first-order rate equation was employed for evaluating kinetics of adsorption. The kad values evaluated, from Lagergren plots was 0.04928 min-1. For 200 mg/L of initial concentration of Reactive Red 195 dye in solution, the optimum process parameters were found to be 1.25 g of activated carbon dosage at 30°C for 75 minute of agitation with optimum percentage removal of dye of ~96%.
Reactive Red 195, Adsorption, Activated charcoal, Design of Experiments (DOE), Response surface methodology.
Dye is a colouring compound consisting of chromophore (colour bearing) and auxochrome (colour helping or colour intensifying) groups. More than 10,000 commercially available dyes exist with over 7 metric tons annual production (Shreve et al., 1977; Mohammad- Khah et al., 2009). The important dye classes used for colouration of various materials are direct, acid, basic, reactive, metal complex, vat, sulphur etc. Among all these dyes, reactive dyes are widely used in textile and allied industries due to their specific characteristics like variety of colour ranges, high fastness properties, versatility in application methods, low cost and minimal energy consumption (Amuda et al., 2006). Colour and high amount of dissolved solids are the important contaminant found in wastewater of reactive dye and need to be removed before discharging into various water bodies or land. In general, textile and dye effluent contains dyes of different varieties, which are inert to chemical reaction and may be toxic. The presence of very small amount of colour in water (<1 ppm for some dyes) is highly visualize and affects the ecological balance of aquatic lives. The discharge of highly coloured effluents into ground water creates not only aesthetically displeasing but also disturbs biological process. Besides this, they are also causing allergic dermatitis, skin irritation, cancer and mutation in human being. Methods for removal of Biological Oxygen Demand (BOD) and other impurities from the effluents are well established. However, dyes are more difficult to treat because of their synthetic origin and complex aromatic molecular structure. Government legislation is also becoming more stringent in the most developed countries regarding the removal of dyes from effluent coming from various allied industries (Kumar et al., 2014). This means, most of the chemical allied processing industries, have to develop on-site or in-plant facilities to treat their own effluents before discharging (Goud et al., 2005; Geçgel et al., 2012). Different materials have been used for removal of dye using the adsorption method (Saleh et al., 2012). Basically, researchers finding is to use eco-friendly, sustainable and inexpensive technologies (Saravanan et al., 2015). Thus, it is worth to investigate the potential adsorption of natural adsorbents from an economic point of view compared to the more expensive Activated Carbon (AC). Due to the remarkable adsorption capability, AC is the most widely used adsorbent in water treatment and has been commonly used as an adsorbent for the removal of various contaminants. However, the manufacture of AC requires high temperature, high pressure and costly activation processes. In addition, a higher operational cost limits the practical applicability of AC for large plants or facilities (Mittal et al., 2010; Regti et al., 2017; Shokry et al., 2019). It is difficult to remove, separate or degrade the Reactive Red 195 (RR-195) dye from water due to its high solubility (Saravanan et al., 2016; Devaraj et al., 2016). Discharge of wastewater containing high amount of RR- 195 lead to environmental problems like eutrophication, and depletion of Dissolved Oxygen (DO) into receiving water body. It also contaminates ground water due to seepage (Saravanan et al., 2013; Afshin et al., 2018; El Qada et al., 2008). The same contaminated water can be used for drinking, cleaning and/or agricultural purpose. Such contaminated water will have large consequences and implications on flora and fauna. Hence, removal of such dye form wastewater using a low cost method is necessary (Saleh et al., 2011; Ahmaruzzaman et al., 2011; Saleh et al., 2012). From review of various competing processes, adsorptive process is found to be most promising (Rani et al., 2015; Jana et al., 2015). Design of Experiments (DOE) minimizes total number of runs to understand the multi parameter effect and it optimizes the process parameters (Ghaedi et al., 2015; Gupta et al., 2014; Saravanan et al., 2013). Therefore, the approach will be to identify the process parameters affecting the performance of adsorption of RR-195 on activated charcoal.
Powdered form of activated charcoal was used for the adsorption of impurities and was supplied by S. D. Fine Chemicals Ltd, Mumbai. Reactive Red-195 dye was obtained from the Meghmani dye industries manufacturer, Ankleshwar in commercial grade form. Characteristics of the dye solution used are shown in (Table 1).
| Dye | Reactive Red 195 |
|---|---|
| Chemical Structure | 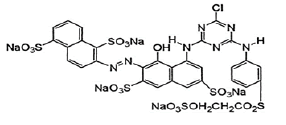 |
| Chemical Formula | C31H19Cl2N7Na5O19S6 |
| Molecular Weight | 1136.32 g/mol |
| Molecular Structure | Single azo class |
| λmax | 540 nm |
Experiment
Coconut Husk was used for the preparation of activated carbon. The raw material was first washed with distillated water, cut, dried and separated using mesh size of 1-3 mm. Then, It was carbonized in a stainless steel vessel in a tube furnace under nitrogen (purified upto 99.99%) flowing at 150 cm /min nearly at 700 °C. The sample was kept for 2 hour at heating rate of 10 °C/min. Produced charcoal was soaked in potassium hydroxide (KOH) solution with ratio of 1:1 as KOH: Charcoal. 24 hours dehydration was performed at 105 °C to remove moisture. For the final activation of charcoal, carbonization was performed with same conditions but at temperature of 850 °C. Product was then cooled under nitrogen gas at room temperature and washed with 0.1 M Hydrochloric Acid (HCL) till pH is reached in between 6-7. The mixture was then dehydrated in an oven. The bet surface area of the prepared AC was found to be 1240 m /g, with total pore volume of 1.012 cm /g. The pore size distribution of the prepare AC is between 2 and 4 nm and average pore diameter of the prepared sample was found to be 2.10 nm. This indicated that, AC was mesoporous, having relatively high surface area.
Initially, 500 ml of 200-ppm reactive dye solution was prepared in the laboratory. 150 ml of dye solution is collected from the sample and added 1 g of prepared AC to it. The whole system was kept on hot plate with stirring mechanism. After 1 hour of stirring, the solution was filtered on the filter paper and then the concentration of dye was measured using an in UV-Vis spectrophotometer. This instrument used to prepare calibration curve of solution to know the unknown solution concentration. The calibration curve is drawn using various known concentration solution in UV-Vis spectrophotometer and value of the absorbance at particular concentration is determined. In order to know the concentration of RR-195 dye using the colorimetric techniques, standard curve was generated from the standard solution of dye. Dye concentration of 110, 120, 130, 140, 150, 160, 170, 180, 190 and 200 ppm were prepared and the absorbance of the solutions was measured, using UV-spectrophotometer at 540 nm wavelength for Reactive Red 195 (Sathiyamoorthy et al., 2012). Calibration curve of Reactive Red 195 is drawn shown in Figure 1.

Figure 1. Calibration curve of Reactive Red 195 dyes.
Design of Experiment (DOE)
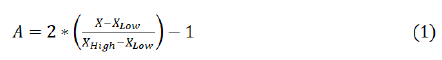
Design of Experiments (DOE) is defined as a branch of applied statistics that deals with planning, conducting, analyzing, and interpreting controlled tests to evaluate the factors that control the value of a parameter or group of parameters. DOE decides the systematic methodological way of performing the laboratory experiment. Box-Behnken Quadratic design is used for the response surface modelling and optimization of the removal of dye. The factors considered are time of agitation, temperature of the system and amount of charcoal added. DOE consists of seventeen sets of experiments having three different level of corresponding factor which are considered as low, middle and high. The experimental range and levels of independent variables are listed in Table 2. Due to large difference in the order of magnitude of the value of independent factors, each factor was coded in between -1 and +1 referring to its low and high value respectively. Following in equation 1, it is used to code or decode the factors. Design of Experiment was done using Design Expert (9.0 Version) and Microsoft office excel (Microsoft Corporation). The experiment was performed in a random manner in order to avoid any systematic bias in the outcomes.
| Variable | Coded value | Chemical Structure | Chemical Structure |
|---|---|---|---|
| -1 | 0 | +1 | |
| Time of agitation (minutes):A | 30 | 75 | 120 |
| Temperature of system (ºC):B | 30 | 40 | 50 |
| Amount of charcoal added (g):C | 0.5 | 1.25 | 2 |
In the experiment, linear and cubic effects were taken care in cubic points while axial point takes care of quadratic effect. Centre points are used for the reproducibility of experiments and to estimate magnitude of error or noise in experimental analysis. Table 3 shows the runs performed for all there parameters.
| Sr No. | A Time (minutes) |
B Temperature (ºC) |
C Charcoal Amount (g) |
|---|---|---|---|
| 1 | 30 | 30 | 1.25 |
| 2 | 120 | 30 | 1.25 |
| 3 | 30 | 50 | 1.25 |
| 4 | 120 | 50 | 1.25 |
| 5 | 30 | 40 | 0.50 |
| 6 | 120 | 40 | 0.50 |
| 7 | 30 | 40 | 2.00 |
| 8 | 120 | 40 | 2.00 |
| 9 | 75 | 30 | 0.50 |
| 10 | 75 | 50 | 0.50 |
| 11 | 75 | 30 | 2.00 |
| 12 | 75 | 50 | 2.00 |
| 13 - 17 | 75 | 40 | 1.25 |
The second order polynomial empirical relationship equation can be given as:
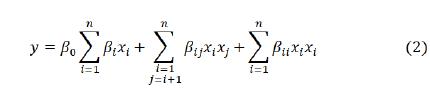
Where, n = number of level
y = response variable
xi = independent variable
β0 , βij = Coefficients of intercept
The coefficients of the polynomial model, which describe the percentage removal of dyes, were calculated by multiple regression analysis on the experimental data. The statistical significance and adequacy of model and its coefficients was analyzed using the Analysis of Variance (ANOVA) using design expert and MS excel. The significance of all regression coefficients was checked by means of student’s t-test. A significance level of P<0.05 (confidence level-95%) was used in all tests. Analysis of Variance (ANOVA) was followed by Fischer F-test of individual factors and interactions.
The parameters to be studied are time of agitation, temperature of system, amount of charcoal loaded, and dye concentration of synthetic water. The study will be in two parts, where initially, single parameter study will be done as preliminary study and multi-parameter study will be done using Box-Behnken method.
Single parameter study
Numbers of parameters are identified in the experiments to study their effects on adsorption i.e. time of agitation after adding activated charcoal, temperature of the system, amount of charcoal added and concentration of dye solution prepared. Single blind study of all parameters is not adequate. Thus, single parameter study as preliminary part was carried out to understand the individual effects. One parameter was kept varying while the others were kept constant. The constant values for single parameter testing are agitation time (60 minutes), temperature of system (30 ºC), amount of charcoal (1 g) and dye concentration (200 ppm).
Effect of agitation time
Time is an important parameter in the adsorption process. Time of agitation was varying between 30 minutes to 120 minutes. The effect of the agitation time on the dye removal is as shown in Figure 2. It is revealed from the experiment that maximum adsorption efficiency was of agitation. Adsorption phenomenon increases with observed at 1 hour increase in the agitation time but after certain value and amount of time, adsorption efficiency starts to decline slowly. Due to the saturation of adsorption capacity of activated charcoal after certain limit of time i.e. up to 60 minutes, there is slight declination observed.

Figure 2. Effect of % dye removal with respect to time at 30ºC, 1 g charcoal dose, and 200 ppm dye solution.
Effect of temperature
Temperature of system was varied from 30 °C to 50 °C. The nature of the graph (Figure 3) reveals that significant decrease in the dye removal is observed with increasing the temperature value. Maximum adsorption efficiency is obtained at room temperature as per Indian standard and whether conditions. Secondarily, lower temperature range favour the high adsorption efficiency. Data reveals that adsorption efficiency gradually deceases with temperature increase. The investigating facts that comes into consideration is the initiation of desorption process while raising the temperature from room temperature to certain temperature range.

Figure 3. Effect of % dye removal with respect to temperature at 60 minutes run, 1 g charcoal dose and 200 ppm dye solution.
Effect of amount of activated charcoal
Amount of charcoal is varied from 0.5 g to 2.0 g during the dye removal process. It was observed from the Figure 4 that, dye removal happens initially with continuously raising the charcoal concentration but after certain limits, there is minor decrease in the efficiency or observed some linearity or nearly constant phenomenon of dye removal during the experimentation. There is almost negligible amount of change observed at 1.5 g charcoal concentration and then continued as steady up to 2 g. Higher the amount of charcoal quantity, more the surface area exposed for the adsorption phenomenon to take place. In this experimental study, it is observed that, more amount of charcoal have not supported the high efficiency rather increase the cost to the synthesis process. Lesser amount or sufficient amount of charcoal acted as efficient medium for the dye removal to acceptable quantity.

Figure 4. Effect of % dye removal with respect to charcoal dose at 60 minutes time, 30ºC temperature and 200 ppm dye solution.
Effect of dye concentration
Concentration of dye plays important role in deciding the dye removal capacity of the adsorbent. It definitely affects the percentage removal of dye during the adsorptive process. Concentration of dye was varied between 100 ppm to 250 ppm. Looking to the intimate result, it was found from Figure 5 that, with the increase in the dye concentration from 100 ppm to 250 ppm, there is slight decrease observed in the dye removal efficiency starting from 100 ppm to 200 ppm.

Figure 5. Effect of % dye removal with respect to dye concentration at 60 minutes time, 30ºC temperature, 1 g charcoal dose.
Drastic decrease of 25% to 30% was witnessed after 200 ppm upto to 250 ppm. At lower concentration of dye, let’s say at 100 ppm, there is higher % dye removal of nearly 98%. Slowly and gradually, with the increase in the dye concentration, there is minor decrease in the dye removal up to 200 ppm. There is slow accumulation of dye on the charcoal surface, which cannot be even observed or witnessed initially, but after certain concentration range, there is remarkable declination observed. After 200 ppm, considerable fall in the dye removal is observed which is notable and provides the remark of parallel consideration of concentration of dye versus adsorbent selection.
Study using DOE
DOE is used for various purposes i.e. to identify relationship between cause and effect, achieving optimum solution or minimum experiment error. If the experiment were performed without DOE in random manner, the result will also be random. Therefore, DOE is used to construct experiment to obtain meaningful output. Furthermore, the effect of single input variable is easy to measure without DOE but for multiple variable systems, it is very difficult to measure individual effect. One has to make one variable in action and others are constant to measure the effect of that particular parameter. Finally, DOE can be used to reduce cost by speed up the process, reducing engineering design, minimum complexity, reducing labour cost etc. Design Expert (version 9.0) was used with three parameter study: (1) Time of agitation (2) Temperature and (3) Amount of charcoal.
Analysis of Response Surface Methodology (RSM)
Considering all controllable factors and screening out most important factor will provide proper optimization of the system. Analysis of Variance (ANOVA) will further filter the parameters using model (Hanrahan et al., 2006). Response Surface Methodology has been found in various applications like predicting the minimum surface in mold surface (Öktem et al., 2005), synthesis of chitosan nanocomposite material (Abdulhameed et al., 2019), highly concentrated mixing phenomenon of solid-liquid in industry (Kazemzadeh et al., 2019). Optimization of biodiesel production from mustard seed oil (Yesilyurt et al., 2019), waste oil (Ayoola et al., 2016), cotton seed oil (Fan et al., 2011), Jatropha carcus (Goyal et al., 2013), Brucea javanica seeds oil (Hasni et al., 2017), rapeseed oil (Zhang et al., 2011) and Moringa oleifera oil (Rashid et al., 2011). Box-Behnken Quadratic model was used for the response surface modeling and optimization of the degradation of Reactive Red 195 dye. The factors considered were: time of agitation, temperature of system and amount of charcoal. Seventeen experiments were carried out at given experimental condition and percentage removal of dyes was measured by UV-Vis spectrophotometer.
ANOVA analysis
The Analysis of Variance (ANOVA) is used to evaluate the statistical significance of the construct models. The ANOVA consists of determining which factors significantly affect the response, using a Fisher’s statistical test (F-test). The significance and the magnitude of the estimated coefficients of each variable and all their possible interactions on the response variables are determined. Effects with a confidence level less than 95% (effects with a p-value higher than 0.05) were discarded and pooled into the error and a new Analysis of Variance was performed for reduced model. In order to show the fitness of the model, regression coefficient (R) will be used. The sets of experimental data with numerical values of independent variables predicted and experimentally calculated with % dye removal on comparison based as shown in Table 4. The R2 values discussed in Tables 5 and 6 adjusted from experimental data are predicted using model in the form of summary. The fitting of the model with the data generated with all possible consequences is as shown in Figure 6.
| Sr. No. |
Independent Variable | Response Variable | |||
|---|---|---|---|---|---|
| A (Time, minutes) | B (Temperature oC) |
C (Charcoal , g) | Dye removal (%) Experimental |
Dye removal (%) Predicted |
|
| 1 | 30 | 30 | 1.25 | 59.43 | 52.345 |
| 2 | 120 | 30 | 1.25 | 64.98 | 61.150 |
| 3 | 30 | 50 | 1.25 | 86.17 | 90.00 |
| 4 | 120 | 50 | 1.25 | 70.81 | 77.89 |
| 5 | 30 | 40 | 0.5 | 52.52 | 59.183 |
| 6 | 120 | 40 | 0.5 | 42.36 | 45.767 |
| 7 | 30 | 40 | 2 | 86.1 | 82.693 |
| 8 | 120 | 40 | 2 | 99.47 | 92.808 |
| 9 | 75 | 30 | 0.5 | 29.78 | 30.202 |
| 10 | 75 | 50 | 0.5 | 77.06 | 66.568 |
| 11 | 75 | 30 | 2 | 64.15 | 74.642 |
| 12 | 75 | 50 | 2 | 93.1 | 92.678 |
| 13 | 75 | 40 | 1.25 | 95.88 | 95.88 |
| 14-17 | 75 | 40 | 1.25 | 95.88 | 95.88 |
| Model Summary Statistics | |||||
|---|---|---|---|---|---|
| Source | Standard Deviation | R2 | Adjusted R2 | Predicted R2 | Remark |
| Linear | 16.23 | 0.5371 | 0.4303 | 0.2688 | Suggested |
| 2FI | 17.59 | 0.582 | 0.3312 | -0.1597 | - |
| Quadratic | 8.13 | 0.9375 | 0.8572 | 0.0002 | Suggested |
| Cubic | 0 | 1 | 1 | - | Aliased |
| Source | Sum of Squares | df | Mean Square | F Value | p-value Prob> F | Remark |
|---|---|---|---|---|---|---|
| Model | 6935.7711 | 9 | 770.6412 | 11.6694539 | 0.0019 | Significant |
| A-Time | 5.445 | 1 | 5.445 | 0.08245105 | 0.7823 | - |
| B-Temperature | 1479.68 | 1 | 1479.68 | 22.4060909 | 0.0021 | - |
| C-Amount Charcoal | 2488.6513 | 1 | 2488.651 | 37.684463 | 0.0005 | - |
| AB | 109.30703 | 1 | 109.307 | 1.65518432 | 0.2392 | - |
| AC | 138.41523 | 1 | 138.4152 | 2.09595596 | 0.1909 | - |
| BC | 83.997225 | 1 | 83.99723 | 1.27193005 | 0.2966 | - |
| A2 | 483.9798 | 1 | 483.9798 | 7.32867601 | 0.0303 | - |
| B^2 | 923.67632 | 1 | 923.6763 | 13.9867915 | 0.0073 | - |
| C^2 | 953.21953 | 1 | 953.2195 | 14.4341503 | 0.0067 | - |
| Residual | 462.2743 | 7 | 66.03919 | - | - | - |
| Lack of Fit | 462.2743 | 3 | 154.0914 | - | - | - |
| Pure Error |
0 | 4 | 0 | - | - | - |
| Core Total | 7398.0454 | 16 | - | - | - | - |
Surface plot
Surface plots are used to represent the optimum values of the input parameters to provide optimum response. Here, in this case optimum dye removal is 95.88% from the graph (Figures 6 to 8). Graphs show the blue to red line which indicates the higher percentage of dye removal. As colour coded becomes blue to red, maximum response was detected. It was revealed that, in order to remove 200 ppm of dye in effluent, the amount of charcoal required is 1.25 g at 30 ºC temperature for 75 minutes time duration will be most effective and optimistic.

Figure 6. Surface plot of % dye removal at constant time (75 minutes).

Figure 7. Surface plot of % dye removal at constant temperature (30ºC).

Figure 8. Surface plot of % dye removal at constant amount of charcoal (1.25 g).
Optimization of Response Surface Model (RSM)
Primary goal of this study was to find out optimum values of independent variables occurring in equation that would maximize the response. RSM was carried out to get the optimum value of the response. Thus, model was optimized using statistical software Design Expert (V 7.0). In order to test the accuracy of obtained optimized values of parameters, it is necessary to repeat the experiments at the optimized condition.
Adsorption isotherm study
Several models have been used in literature to describe the experimental data of adsorption isotherms. The Langmuir and Freundlich models are the most widely used. Freundlich and Langmuir constants were derived at temperature 30 ºC as shown in Figures 9 and 10. These plots describe adsorption capacity which was found to increase with rising temperature. Freundlich adsorption isotherm is a curve relating the concentration of a solute on the surface of an adsorbent to the concentration of the solute in the liquid with which it is in contact. Langmuir visualized the dynamic equilibrium between adsorbate molecules in the gas phase at a pressure P and the adsorbed entities in the surface layer, the fraction of the site covered being θ. Table 7 indicates the corresponding values for both the isotherms.
| Freundlich and Langmuir Isotherms data | |||||
|---|---|---|---|---|---|
| Ce | qe | 1/Ce | 1/qe | log Ce | log qe |
| 43.67 | 23.449 | 0.0229 | 0.04265 | 1.64018 | 1.37012 |
| 26.922 | 25.961 | 0.03714 | 0.03852 | 1.43011 | 1.41432 |
| 27.61 | 25.858 | 0.03622 | 0.03867 | 1.44107 | 1.41259 |
| 28.27 | 25.759 | 0.03537 | 0.03882 | 1.45133 | 1.41093 |

Figure 9. Freundlich isotherm for RR 195 dye on activated charcoal.

Figure 10. Langmuir adsorption isotherm for RR 195 dye on activated charcoal.
To find out dimensionless constant, separation factor (r) is to be calculated first.
r=1/(1+bCo) (3)
Where, b and C values are derived from Langmuir isotherm.
r value indicates the nature of the adsorption.
If r>1, r=1, r<1 and r=0, the adsorption process is unfavorable, linear, favorable and reversible respectively. Here, in our case r value is less than 1 which indicates that adsorption process is favourable. Thermodynamics Gibb’s free energy was also calculated using following equation
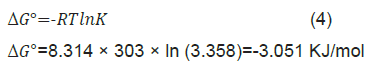
Where, K is equilibrium constant evaluated from slope of the adsorption isotherm. (Here, ΔG=-3.051 KJ/mol at 30 ºC). Negative value of ΔG shows the feasibility of the adsorption process.
Kinetic study
For more effective representation of the process, kinetic parameters were calculated. Rate constant kad has been calculated using Lagergren first order rate equation.

Where, qe and qt are amount of adsorbed at equilibrium and time t. Graph of log (qe-qt) vs. t is shown in (Figure 11) where kad value was obtained as 0.04928 min-1 having the scope value as −kad/2.303.

Figure 11. Lagergren’s plot of time vs. log (qe-qt) for RR 195 dye on activated charcoal.
In the present study, adsorption of Reactive Red (RR-195) was studied using activated charcoal as the adsorbent. The study was conducted batch-wise in two parts. First part deals with preliminary runs to understand the behaviour of each parameter. In second part, the multiparameter effect was studied and optimized using Response Surface Methodology. Total 17 runs were generated using Box- Behnken Design. Design Expert (9.0 trial version) was used to study and optimize the multi-parameters. Apart from optimisation, adsorption isotherm, thermodynamic and kinetic study was also done. The separation factor was less than one which indicates the favourable adsorption process. Gibbs free energy was also evaluated which was -3.051 KJ/mol at 30 ºC. The negative value shows the feasibility of the adsorption. Adsorption isotherm studies using Langmuir and Freundlich isotherms were performed. In both the cases linear plots were obtained, which reveal the applicability of these isotherms on the ongoing adsorption process. For the effectual designing and representation of the ongoing process, kinetics parameters were calculated. In order to study the specific rate constant of Reactive Red- 195 on activated carbon, the well-known Lagergren first- order rate equation was employed. Values of log (qe-qt) was calculated was found to be first order rate kinetics for the ongoing adsorption process. The kad values evaluated, from Lagergren plots were found to be 0.04928 min-1. The optimized conditions using Box-Behnken Design for 200 ppm of initial dye concentration was as follows in Table 8.
| Parameter | RR 195 Dye |
|---|---|
| Amount of charcoal (g) | 1.25 |
| Temperature (ºC) | 30 |
| Time (minutes) | 75 |
| % Dye removal | 95.88 % |
Citation: Mehta J, P anwar D , Metre AV , B hask har MS. (2021) Adsorptive studies of Reactive Red 195 dye on activated charcoal optimized with response surface methodology. J Res Environ Sci Toxicol 10(5): pp.80-88