Review Article - International Research Journal of Agricultural Science and Soil Science ( 2021) Volume 10, Issue 5
Received: 09-Jul-2021 Published: 17-Sep-2021
Land use and land cover change is driven by human actions and also drives changes that limit availability of products and services for human and livestock, and it can undermine environmental health as well. Therefore, this study was aimed at understanding land use and land cover change in Kersa district over the last 30 years. Time-series satellite images that included Landsat 5 TM, Landsat 7 ETM+, and Landsat 8 OLI/TIRS, which covered the time frame between (1990-2020), were used to determine the change in land use and land cover using object based classification. The object based classification result revealed that in 1990 TM Landsat imagery, natural forest (16.07%), agroforestry (9.21%), village (12.03%), urban (1.93%), and agriculture (60.76%) were identified. The change result showed a rapid reduction in natural forest cover of 25.04%, 9.15%, and 23.11% occurred between (1990-2000), (2000-2010) and (2010-2020) study periods, respectively. Similarly agroforestry decreased by 0.88% and 63.9% (2000-2010) and (2010-2020), respectively. The finding indicates the increment of agricultural land, village, and urban, while the natural forest and agroforestry cover shows a declining trend. Overall, proper and integrated approach in implementing policies and strategies related to land use and land cover management should be required in Kersa District.
Land use and land cover change, Kersa district, Change detection
ERDAS: Earth Resource Data Analysis System; LULC: land use land cover; LULCC: land use land cover change; USGS: United State Geological Survey; TM: Thematic Mapper; ETM+: Enhanced Thematic Mapper; OLI/TIRS: operational land imager/thermal infrared sensor; GIS: Geographic Information System; GPS: Global Positioning System.
Land use and land cover change (LULCC) ; Also known as land change) is a general term for the human modification of Earth's terrestrial surface. Though humans have been modifying land to obtain food and other essentials for thousands of years, current rates, extents and intensities of LULCC are far greater than ever in history, driving unprecedented changes in ecosystems and environmental processes at local, regional and global scales. These changes encompass the greatest environmental concerns of human populations today, including climate change, biodiversity loss and the pollution of water, soils and air (Ellis, 2007). Time series analysis of land cover change and the identification of the driving forces responsible for these changes are needed for the sustainable management of natural resources and also for projecting future land cover trajectories (Giri et al., 2003).
Therefore, available data on land use and land cover (LULC) changes can provide critical input to decision-making of environmental management and planning the future. Determining the effects of land use and land cover change on the earth system depends on an understanding of past land use practices, current land use and land cover patterns and projection of future land use and land cover, as affected by human distribution, economic development, technology and other factors (Thadiparthi and Mekonnen Aregai, 2011, as cited in Abiy, 2014). Detecting land use change over time has become increasingly important consideration for environmental management (Kiswanto and Mardiany 2018; Mensah et al., 2019). Therefore, studying the rate of LULCC support a decision making processes. Due to world population boom and advancement in science and technology, the natural resources are overexploited for the sake of economic activities with high severity in developing countries. Agricultural expansion into the forest land, timber logging, charcoal production and fire wood harvesting are the major drivers of deforestation in Africa (Declee et al., 2014; Muhati et al., 2018).
Changes in LULC can alter the supply of ecosystem services and affect the well-being of humanity (Rimal et al., 2019; Deng et al., 2013; Olson et al., 2008). The LULC has the potential to influence the biological processes, and alter the provision of ecosystem services (Gibson et al., 2018; Geng et al., 2015; Kishtawal et al. 2010). The change in LULC has an impacts on hydrological fluxes (Guzha et al., 2018), regional climate (Geng et al., 2015; Costa et al., 2003), agricultural production (Deng et al., 2013) and greenhouse gas emissions (Furukawa et al., 2015; Findell et al., 2007). In addition, it is also one of the factors for local environment disturbance by influencing runoff, soil loss, stream flow, and (Cheruto et al., 2016).
Due to rising population over the years, lots of pressure has been imposed on the land resources in Ethiopia where approximately 85% of the populace engages in agriculture. As a result, the shortage of arable land has led to expansion of cultivation into the water margins of rangelands, deforestation and decline of grassland as a result of overgrazing, charcoal burning and other unsustainable land uses. These actions have far reaching implications on the integrity of natural resources and ecosystems in the country.
LULCCs have also taken place in Kersa district, Oromia region over the years. Land has been subjected to a lot of pressure due to over-reliance on its resources. There has also been rapid population growth in the county in the recent past and this has translated to over-utilization of land and its resources. Most communities are farmers and they therefore depend on land for their livelihood well-being and sustenance. This has resulted to the locals engaging in other sustenance activities such as charcoal burning, logging and even sand harvesting, all of which result to environmental degradation.
Therefore, attempt was made in this study to map out the status of land use land cover of Kersa district, Oromia region between 1990 and 2020 with a view to detect the land changes that has taken place using remote sensing and GIS. The objectives of this study were to (i) to identify and map the extent of LULC change over a period of 3 decades, (ii) to understand changes in land use and land cover occurring in Kersa district based on analysis of remotely sensed data, and (iii) to determine the nature, rate and location of land use and land cover change.
Description of the study area
Location and Relief: The study was undertaken in Kersa district, which is one of the districts in the Jimma Zone of the Oromia Region of Ethiopia. It is bordered on the south by Dedo district, on the southwest by Seka Chekorsa district, on the west by Mana district, on the north by Limmu Kosa district, on the northeast by Tiro Afeta district, and on the southeast by Omo Nada district. The coordinate values that extend from 7º40'25"N to 7º56'35" N and 36º54'10"E to 37º10'20"E covering a total area of 103001.34 km2 (Figure 1). The altitude of this district ranges from 1740 to 2660 meters above sea level and covers slope range from flat (0º) to very steep (71º). The district receives 2935 mm annual rainfall. Kersa district has a tropical rainforest climate (Af) under the Köppen climate classification. Temperature at Kersa is in a comfortable range, with the daily mean staying between 20°C and 25°C year-round.

Figure 1. Location map of the study area.
Data source and pre-processing
Four satellite images (Landsat-5 TM 1990, Landsat-7 ETM+ 2000 and 2010, and Landsat-8 OLI/TIRS 2020) with 30m spatial resolution were used for the LULC change analysis of the studied district. Details of the images characteristics are tabulated in Table 1. Landsat data were downloaded free of charge from U.S Geological Survey (USGS) Center for Earth Resources Observation and Science (EROS) (https:// earthexplorer.usgs.gov/). All images were geometrically corrected and acquired in level 1T (L1T). Except for Landsat image of the years 1990 and 2020, the time gap between the satellite images was more than 16 days, because of cloudiness.
| Satellite image | Path/row | Sensor | Resolution/scale (m) | Acquisition date |
|---|---|---|---|---|
| Landsat-5 | 169/55 | TM | 30 | 25/12/1990 |
| Landsat-7 | 169/55 | ETM+ | 30 | 27/01/2000 |
| Landsat-7 | 169/55 | ETM+ | 30 | 11/03/2010 |
| Landsat-8 | 169/55 | OLI/TIRS | 30 | 27/12/2020 |
The image processing was performed using the ERDAS Imagine 15 and Arc GIS 10.4.1 software. Google Earth images were used as a base map for image classification. A pixel based supervised classification with Maximum Likelihood Classification (MLC) algorism was undertaken using the ground truth points collected from each LULC category. A total of 150 GPS points (30 GPS points in each LULC), were undertaken for supervised classification. In classifying the 1990, 2000 and 2010 images, reference data from Google earth images from the corresponding time periods were collected. Hand held Global Positioning System (GPS Garmin 72) was also used to collect ground control point for the year 2020.
Images were classified into five LULC classes; namely natural forest, agroforestry, village, urban and farmland (Table 2).
| LULC classes | Description |
|---|---|
| Natural Forest | Area covered with tall trees |
| Agroforestry | Areas covered with trees and used for farming |
| Village | Areas used for settlement |
| Urban | Area covered with urban |
| Agriculture | Areas used for farming activity without any trees including grazing land |
Land use and land cover change analysis
Change detection involves the use of multi-temporal datasets to discriminate areas of land cover change between dates of imaging. Change analysis was conducted using post classification image comparison technique. Post classification change analysis is selected in order to minimize possible effects of atmospheric variations and sensor differences. The post classification change detection method was found to be the most suitable for detecting land use and land cover change. Post-classification comparison can provide a complete matrix of change directions (Lu et al., 2003; as cited in Ashenafi Burqa, 2008). Then the raster data was converted into vector layer by using Arc GIS 10.4.1 software and LULC classes was classified. After classification of LULC their maps was prepared, and forest cover changes of the study area were analyzed. The classified images were compared in three periods i.e. 1990-2000, 2000-2010 and 1990-2020. Quantification of the rate of change has been applied to generate information about the land use and land cover dynamics of the study area. To calculate the percentage of LULUC (%), the initial and final LULC area coverage was compared as indicated in Eq. 1 and 2 respectively.
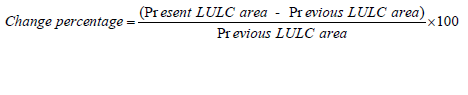 (Eq. 1)
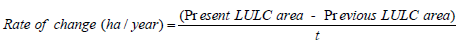 (Eq.2)
Where t= Interval year between the initial year and recent year
Accuracy assessment
Accuracy assessment was done to understand the representation of the classified images on the ground (Mosammam et al., 2016). If the reference data is highly inaccurate, assessment might indicate that classification results are poor. To do accuracy assessment for the classified images, 150 random sample points were created. Reference points were collected for the 1990, 2000, 2010 and 2020 classified images from the corresponding Google Earth images. Then, the classified images were compared with the reference images by means of error matrix. Various measures of accuracy assessment such as producer accuracy, user accuracy, overall accuracy and Kappa coefficient were done. Overall accuracy was used to calculate a measure of accuracy for the entire image across all classes present in the classified image (Eq. 3) While kappa statistics value is a measure of the agreement between classification and reference data (Mishra et al., 2019) ranked the kappa values, ranging from -1 to 1, into three groups: (1) greater than 0.80 represented strong agreement (2) between 0.40 and 0.80 represented moderate agreement, and (3) less than 0.40 represented poor agreement between the classification and reference data. The Kappa coefficient was calculated using (Eq. 4).
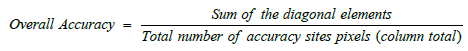 Eq. 3
Eq. 3
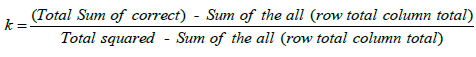 Eq.4
Eq.4
LULC change analysis
Using multi spectral images from Landsat TM, ETM+ and OLI/TIRS images of 1990, 2000, 2010 and 2020 and the application of image classification methods, five major land uses and land cover types were identified. These included; natural forest, agroforestry, village, urban, and agricultural land.
In 1990, the highest extent of land use and land cover from all classes was agricultural land, which covers an area of 62,581.8 ha, contributes (60.76 %) of the total area.
Natural forest and village (rural settlement) land cover an aerial size of 16,557 ha (16.07 %) and 12,386.3 ha (12.03 %) respectively, whereas the aerial coverage of agroforestry and urban was 9,488.9 ha (9.21 %) and 1,987.3 ha (1.93 %) from the total area of the district (Figure 2 and Table 3).

Figure 2. A: land use and land cover map of 1990 B: Aerial coverage and percentage of land use and land cover types in 1990.
| LULC classes | 1990 | 2000 | 2010 | 2020 | ||||
|---|---|---|---|---|---|---|---|---|
| Area (ha) | % | Area (ha) | % | Area (ha) | % | Area (ha) | % | |
| Natural Forest | 16557 | 16.07 | 12410.5 | 12.05 | 11274.8 | 10.95 | 8669.34 | 8.42 |
| Agroforestry | 9488.9 | 9.21 | 9967.97 | 9.68 | 9880.29 | 9.59 | 3566.79 | 3.46 |
| Village | 12386.3 | 12.03 | 12703.9 | 12.33 | 13124.6 | 12.74 | 15232.1 | 14.79 |
| Urban | 1987.3 | 1.93 | 2465.01 | 2.39 | 2685.83 | 2.61 | 5573.34 | 5.41 |
| Agriculture | 62581.8 | 60.76 | 65453.9 | 63.55 | 66035.8 | 64.11 | 69959.7 | 67.92 |
| Total | 103001.3 | 100 | 103001.3 | 100 | 103001.3 | 100 | 103001.3 | 100 |
As indicated in (Figure 3 and Table 3) the greatest share of land use and land cover from all classes was agricultural land, which covers 65,453.9 ha (63.55 %) above half of the total area of the district. Village and settlement covers 12,703.9 ha (12.33 %) and 167.31 ha (17.50%), respectively. The least area was covered by agroforestry and urban, which was 9,967.97 ha (9.68%) and 2,465.01 ha (2.39%) from the total size of the study area. Agriculture still covered the largest area in 2000, which depicts conversion of other land cover classes to cultivated land.

Figure 3. A: land use and land cover map of 2000. B: Aerial coverage and percentage of land use and land cover types in 2000.
By the year 2010, the areal coverage of agricultural land, urban and rural settlement increased by 66,035.8 ha (64.11%), 2,685.83 ha (2.61%) and 13124.6 ha (12.74%), respectively. Statistical data shows that the coverage of natural forest and agroforestry area decreased by 11274.8 ha (10.95%) and 9880.29 ha (9.59%), respectively. The growth of agriculture was due to the conversion of forest and agroforestry to agricultural land because of rapid population growth in the study area. In addition to this there was an expansion of urban and rural settlement (village) in 2010 due to population growth. In 2020, the coverage of natural forest and agroforestry were decreased by 8,669.34 ha (8.42%) and 3566.79 ha (3.46%) while the coverage of agriculture, urban and village (rural settlement) were increased to, 69,959.7 ha (67.92%), 5,573.34 ha (5.41%) and 15,232.1ha (14.79%), respectively. The analysis of LULCC, we found that the farmland increased rapidly while natural forest and agroforestry were decreased more than half over the last 30 years in the study area (Figure 4, 5 and Table 3). The finding of this study is consistent with other studies carried out by (Negassa et al., (2020) in Komto Protected forest priority area, East Wollega Zone, Ethiopia; (Gebremicael et al.,) (013) in Blue Nile basin (Temesgen et al., 2014a) in Dera district of northwestern Ethiopia; where the agricultural land increased significantly where forest land was shrinking.

Figure 4. A: land use and land cover map of 2010. B: Aerial coverage and percentage of land use and land cover types in 2010.

Figure 5. A: land use and land cover map of 2020. B: Aerial coverage and percentage of land use and land cover types in 2020.
Accuracy assessment
The classification accuracy was evaluated through the confusion matrix. The classified images showed an OA of 83.33%, 78.67%, 87.33%, and 90.67%, in 1990, 2000, 2010, and 2020 images, respectively, while the kappa statistics of 0.7%, 0.62%, 0.77%, and 0.83% respectively (Table 4). A result of user’s accuracy shows that in 1990 the maximum class accuracy was for farmland (agriculture) (92%) and the minimum was for agroforestry (76.47%). In 2000, user’s accuracy ranges from lowest accuracy (65.71%, agroforestry) to relatively correctly classified (89.66%, urban) whereas in the period 2010, it was ranges from 82.76% agroforestry 92.59% agricultural land. In addition the user’s accuracy was range from minimum (82.86%, natural forest) to the maximum (100%, farmland). Results of producer’s accuracy showed that natural forest, village (rural settlement), natural forest, and agricultural land were relatively correctly classified: 90%, 90%, 93.33%, and 100% in 1990, 2000, 2010, and 2020 respectively. The lowest accuracy was village and agriculture (76.67%), agroforestry (76.67%), agroforestry (80%), and agroforestry (83.33%) in 1990, 2000, 2010, and 2020, respectively.
| LULC classes | Accuracy (%) | |||||||
|---|---|---|---|---|---|---|---|---|
| 1990 | 2000 | 2010 | 2020 | |||||
| Producer’s | User’s | Producer’s | User’s | Producer’s | User’s | Producer’s | User’s | |
| Natural Forest | 90 | 90.00 | 83.33 | 89.29 | 93.33 | 87.50 | 96.67 | 82.86 |
| Agroforestry | 86.67 | 76.47 | 76.67 | 65.71 | 80.00 | 82.76 | 83.33 | 89.29 |
| Village | 76.67 | 79.31 | 90.00 | 72.97 | 90.00 | 84.38 | 93.33 | 90.32 |
| Urban | 86.67 | 81.25 | 86.67 | 89.66 | 90.00 | 90.00 | 93.33 | 93.33 |
| Agriculture | 76.67 | 92.00 | 56.67 | 80.95 | 83.33 | 92.59 | 86.67 | 100.00 |
| Overall accuracy | 83.33 | 78.67 | 87.33 | 90.67 | ||||
| Kappa coefficient | 0.7 | 0.62 | 0.77 | 0.83 | ||||
Change detection of LULC in the district
The conversions of one LULC category to another between 1990-2000, 2000-2010, and 1990-2020 periods are presented in (Tables 5, 6, and 7). The diagonals in the matrix from the tables are the persistence while the of-diagonals are the conversions from one category to the others. The change detection analysis indicated the significant conversions in LULC. An important aspect of change detection is to determine what is actually changing to what category of land use and land cover type i.e. which land use class is changing to the other type of land use class. This information will also serve as a vital tool in management decisions. This process involves a pixel to pixel comparison of the study year images through overlay analysis. The land use land cover change matrix depicts the direction of change and the land use type that remains as it is at the end of the day.
| 2000 | |||||||
|---|---|---|---|---|---|---|---|
| Class Name | Natural Forest | Agroforestry | Village | Urban | Agriculture | Total | |
| 1990 | Natural Forest | 12257.61 | 683.28 | 485.1 | 56.47 | 3074.54 | 16557 |
| Agroforestry | 106.3 | 8450.84 | 146.59 | 69.97 | 715.21 | 9488.91 | |
| Village | 31.41 | 61.65 | 3140.88 | 347.53 | 8804.81 | 12386.28 | |
| Urban | 0 | 0.27 | 22.59 | 1899.59 | 64.89 | 1987.34 | |
| Agriculture | 15.18 | 771.93 | 8908.74 | 91.45 | 52794.5 | 62581.8 | |
| Total | 12410.5 | 9967.97 | 12703.9 | 2465.01 | 65453.95 | 103001.3 | |
| 2010 | |||||||
|---|---|---|---|---|---|---|---|
| 2000 | Class Name | Natural Forest | Agroforestry | Village | Urban | Agriculture | Total |
| Natural Forest | 10791.92 | 1309.26 | 100.26 | 0.81 | 208.25 | 12410.5 | |
| Agroforestry | 376.74 | 7878.97 | 101.17 | 9.63 | 1601.46 | 9967.97 | |
| Village | 68.21 | 172.94 | 3955.91 | 230.49 | 8276.31 | 12703.86 | |
| Urban | 0 | 0.29 | 332.55 | 1694.75 | 437.44 | 2465.03 | |
| Agriculture | 37.97 | 518.8 | 8634.68 | 750.15 | 55512.3 | 65453.9 | |
| Total | 11274.84 | 9880.26 | 13124.57 | 2685.83 | 66035.76 | 103001.3 | |
| 2020 | |||||||
|---|---|---|---|---|---|---|---|
| 1990 | Class Name | Natural Forest | Agroforestry | Village | Urban | Agriculture | Total |
| Natural Forest | 7720.67 | 1507.77 | 227.34 | 743.85 | 6357.42 | 16557.05 | |
| Agroforestry | 350.17 | 1369.17 | 863.55 | 188.91 | 6717.11 | 9488.91 | |
| Village | 53.19 | 83.7 | 3085.38 | 1135.89 | 8028.08 | 12386.24 | |
| Urban | 0.09 | 0 | 19.71 | 1884.92 | 82.58 | 1987.3 | |
| Agriculture | 545.22 | 606.15 | 11036.2 | 1619.77 | 48774.5 | 62581.84 | |
| total | 8669.34 | 3566.79 | 15232.18 | 5573.34 | 69959.69 | 103001.3 | |
In the 1990-2000 periods, 3074.54, 715.21, 8804.81, and 64.89 ha of agricultural land were converted from natural forest, agroforestry, village and urban area, respectively. This shows that agricultural land was gained from other LULC categories, a significant area of agricultural land were also reverted to natural forest, agroforestry, village, and urban area (Table 5). During these time, some area of village was also converted from natural forest (485.1 ha), agroforestry (146.59 ha) urban (22.59 ha), and agriculture (8908.74 ha). Similarly urban land was gained from Natural forest (56.47 ha), village (347.53 ha), agroforestry (69.47 ha), and agriculture (91.45 ha) Although it is a small proportion, 5, 3 and 1 ha of village area was also in reverse converted to natural forest, agroforestry, urban, and agricultural land, respectively. Gains and losses in natural forest and agroforestry were also taken place during these periods (Table 5)
In the second study period, 2000-2010, similar pattern has been observed as the first one, the area of agricultural land increased to11274.84 ha although its area simultaneously was lost to natural forest (37.97 ha), agroforestry (518.8 ha), village (8634.68 ha), and urban (750.15 ha) (Table 6). The most important contributors to the increase of agricultural land were village (8276.31 ha) and agroforestry (1601.46 ha).
During 1990-2020 periods which span over thirty (30) years and estimates the current state of the LULC changes. During these periods, 6357.42, 1507.77, 743.85, and 227.34 ha of natural forest were converted to agricultural land, agroforestry, urban and village, respectively. About 6717.11, 863.55, 350.17, and 188.91 ha of agroforestry were also converted to agricultural land, village, natural forest and urban area, respectively. Similarly, urban and village were also gained from other LULC categories (Table 7). In these periods, a significant area of agricultural land were converted from village (8028.08 ha), agroforestry (6717.11 ha), natural forest (6357.42 ha) and urban area (82.58 ha). In reverse, there was also a considerable conversion of cultivated land to other categories. A significant amount of gains in urban and village area were also occurred in these periods (Table 7).
Rate of LULC change
Between 1990 and 2000, agricultural land increased with a rate of 287.21 ha/year and further increased in 2020 with accelerated rate of change 392.39 ha/ year. The expansion of agricultural land was by the outflow of agricultural land and agroforestry as it is explained in the change matrix of (Table 8). From (1990 to 2000) 4146.5 ha of natural forest had been changed to agricultural land. Between 2000-2010, 1135.7 and 87.7 ha of natural forest and agroforestry had been changed to agricultural land respectively. This shows that there was an expansion of agricultural land within the specified time period because of population pressure and poor land administration.
| Class Name | Rate of change | |||||||
|---|---|---|---|---|---|---|---|---|
| 1990-2000 (ha/year) | % | 2000-2010 (ha/year) | % | 2010-2020 (ha/year) | % | 1990-2020 (ha/year) | % | |
| Natural Forest | -414.65 | -25.04 | -113.57 | -9.15 | -260.55 | -23.11 | -262.92 | -47.64 |
| Agroforestry | 47.91 | 5.05 | -8.77 | -0.88 | -631.35 | -63.90 | -197.40 | -62.41 |
| Village | 31.76 | 2.56 | 42.07 | 3.31 | 210.75 | 16.06 | 94.86 | 22.98 |
| Urban | 47.77 | 24.04 | 22.08 | 8.96 | 288.75 | 107.51 | 119.53 | 180.45 |
| Agriculture | 287.21 | 4.59 | 58.19 | 0.89 | 392.39 | 5.94 | 245.93 | 11.79 |
On the contrary, natural forest had ben decreased from 1990 to 2000 with 25%/year rate of change and further decreased in 2020 with rate of 23%/year. For the time period between 2010 and 2020, the rate of change shows significant decrease in both agroforestry and natural forest but, the maximum decrease is in agroforestry class with 631.35 ha/ year (63.9%) and for natural forest 260.55 ha/year (23.11%) and maximum increment was 288.75 ha/year (107.51%) for class of urban followed by village and agriculture with 210.75% ha/year (16.06%) and 392.39 ha/year (5.94%), respectively. The increment of rate of change in village class and the decrement rate of change in agroforestry and natural forest in the period from 2000-2020 is due to the construction of Gilgel Gibe 2 dam. The rapid decrease in these two classes indicates that there was the conversion these classes by the surrounding community to improve their livelihood. In general scenario (1990-2020), the rate of change indicates that urban, agriculture, and village classes were increased 119.53 ha/year (180.45%), 245.93 ha/year (11.79%), and 94.86 ha/year (2298%), respectively. While natural forest and agroforestry shows continued decreases in the study period (Table 8).
The study has clearly indicated there was a significant amount of LULC conversions had occurred from 1990 to 2020 periods in the study area. Agricultural land, village, and urban areas had been increased in the period of 1990 to 2020. In contrast, natural forest and agroforestry had been decreased in coverage.
Avoiding clearance of natural forest and agroforestry through awareness. In addition, proper and integrated approach in implementing policies and strategies related to land use and land cover management should be considered. Enhancing productivity using proper technologies needs to be induced to minimize expansion of agriculture into forest lands.
The three Landsat images were downloaded from USGS) Center for Earth Resources Observation and Science (EROS). Primary data were also obtained through field works and depth discussions with local elders which were selected from local community and agricultural development agents.