Research Article - International Research Journal of Agricultural Science and Soil Science ( 2025) Volume 14, Issue 1
Received: 02-Mar-2024, Manuscript No. IRJAS-25-128714; Editor assigned: 05-Mar-2024, Pre QC No. IRJAS-25-128714 (PQ); Reviewed: 19-Mar-2024, QC No. IRJAS-25-128714; Revised: 17-Mar-2025, Manuscript No. IRJAS-25-128714 (R); Published: 24-Mar-2025, DOI: 10.14303/2276-6502.2025.34
This experimentation is directed at determining the ecological status of groundwater (object) formed in Amudarya district of the Republic of Karakalpakstan, by developing a quality index with the CCME WQI model, to evaluate the object (the quality index was analyzed by months). In this small-scale ecosystem, agricultural activities based on a slightly wrong strategy and low-level industrial enterprises exist, which is one of the main factors affecting the decline of groundwater quality in this area.
CCMEWQI, Groundwater, Excellent, Good, Fair, Marginal, Poor, Ecological factors
Regular monitoring and evaluation is necessary to maintain a "good" status of groundwater quality. Dr. Galal Uddin, a researcher at the University of Galway, said Water Quality Index (WQI) models are one of the most common and convenient ways to assess water quality (Chabuk A, et al., 2020). The WQI consists of five components, the indicator selection technique is one of the most important components and wrongly selected indicators lead to significant uncertainty (Oseke FI, et al., 2021).
Maintaining a positive status of groundwater quality is an important issue worldwide as water quality gradually deteriorates due to various factors, including natural, anthropogenic or a combination of both (Pham H, et al., 2017). Groundwater is one of the important issues in maintaining the natural state of ecosystems (Ram A, et al., 2021). Recently, many studies have shown that the water environment is decreasing day by day due to water pollution (Uddin MG, et al., 2017). The use of WQI models in water quality monitoring for the purpose of water resources management is one of the most convenient approaches (Uddin MG, et al., 2022).
A number of tools and methods are used in many scientific literatures to monitor and evaluate water quality (Uddin MG et al., 2024). WQI is a widely used, simple mathematical model that converts a wide range of water quality indicators into a unitless numerical expression (Venkatramanan S, et al., 2016). Its use for management and monitoring purposes is growing rapidly. To date, more than thirty WQI models have been developed by organizations and researchers of different countries of the world. Currently, many studies are using state-of-the-art innovative methods such as artificial intelligence and several other algorithmic approaches to optimize model uncertainty in WQI model development.
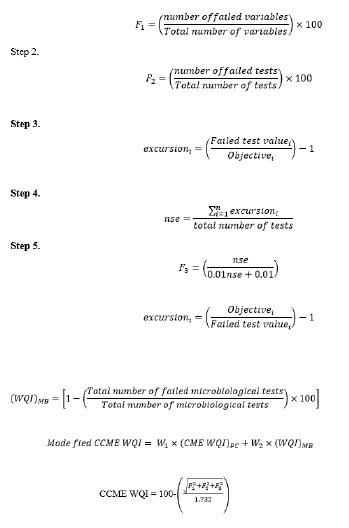
The CCME WQI is based on a formula developed by the Council of Environment Canada and the British Columbia Ministry of Environment, Lands and Parks and modified by Alberta Environment. The index is based on a combination of three factors: Scope, Frequency and the Amplitude. After determining the parameters that provide information about the object, F1, F2 and F3, which make up the index, are calculated (Tables 1-3).
| WQI range | Ranking of water quality | Remarks |
| 95-100 | Excellent | Water quality is protected with a virtual absence of threat or impairment; conditions very close to natural or pristine levels. |
| 80-94 | Good | Water quality is protected with only a minor degree of threat or impairment; conditions rarely depart from natural or desirable levels. |
| 65-79 | Fair | Water quality is usually protected but occasionally threatened or impaired; conditions sometimes depart from natural or desirable levels. |
| 45-64 | Marginal | Water quality is frequently threatened or impaired; conditions often depart from natural or desirable levels. |
| 0-44 | Poor | Water quality is almost always threatened or impaired; conditions usually depart from natural or desirable levels. |
Table 1. Classification of water quality based on CCME-WQI values.
Calculate the index:
Step 1. Calculating the scope value (F1).
| Months | ||||
| Parameters | BIS standards | March | April | May |
| PH | 6.5 | 8 | 7.9 | 7.9 |
| TDS | 500 | 1730 | 1730 | 1480 |
| Cl- | 200 | 276.5 | 354.2 | 327.6 |
| SO4-2 | 200 | 264 | 230 | 177.6 |
| NO3- | 45 | 10.4 | 14.2 | 0 |
Table 2. The condition of groundwater in Amudarya district (2022).
| Months | ||||
| Parameters | BIS standards | March | April | May |
| PH | 6.5 | 7.7 | 7.7 | 8 |
| TDS | 500 | 1 200 | 1 700 | 1 280 |
| Cl- | 200 | 221 | 380 | 308.6 |
| SO4-2 | 200 | 271 | 334 | 0 |
| NO3- | 45 | 10.2 | 10.7 | 9.9 |
Table 3. The condition of groundwater in Amudarya district (2021).
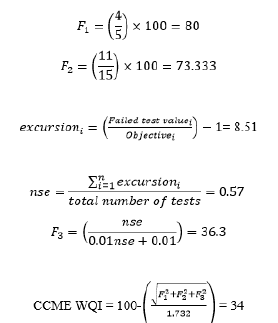
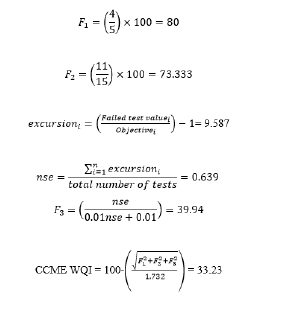
Based on the CCME WQI model, the analysis of 5 parameters data of the object showed negative results. Appropriate measures should be developed to improve the ecological status of groundwater. For example, it is necessary to use agroecosystems in agriculture wisely, to grow green plants that improve the soil fertility and of course to develop monthly and annual indices of groundwater in this area.
[Crossref] [Google Scholar] [PubMed]
[Crossref] [Google Scholar] [PubMed]