Research Article - International Research Journal of Engineering Science, Technology and Innovation ( 2023) Volume 1, Issue 3
Received: 06-Aug-2020, Manuscript No. irjesti-23-13051; Editor assigned: 11-Aug-2020, Pre QC No. irjesti-23-13051; Reviewed: 25-Aug-2020, QC No. irjesti-23-13051; Revised: 02-Jun-2023, Manuscript No. irjesti-23-13051; Published: 30-Jun-2023, DOI: 10.14303/2315-5663.2023.106
Anchote tuber has been used as indigenous food in western parts of Ethiopia. The production of anchote starch was done by different chemical solutions, such as sodium chloride, sodium metabisulphite, ammonia with different concentrations (0.5%, 1% and 1.5%) and with water as control. The starch was isolated by peeling, chopping, grinding, filtration, sedimentation, decantation of the supernatant, drying. The maximum yield of the starch was 20.86% fwb with a 1.5% sodium chloride solution. Bulk density, true density, tapped density, Carr’s index and Hausner ratio of anchote starch were 0.46, 1.5, 0.65, 23.97 and 1.32 respectively. The x-ray diffraction result of the starch had the strongest sharp peak diffraction pattern at 17.12° of 2θ angle which indicates the B-type starch. The moisture, ash, fat, fiber, protein, total carbohydrate, amylose content and starch purity were 12.14%, 0.3%, 0.04%, 1.64%, 1.66%, 83.82%, 17.42% and 95.6% respectively. The pH of the starch was 7.32. The functional properties of the starch such as water and oil absorption capacity were recorded as 0.17 for both samples. Swelling power and solubility index of the starch with increasing temperatures (30°C, 50°C, 70°C and 90°C) were respectively (1.90, 2.53, 8.10 and 11.65) and (0.31, 0.9, 4.8 and 15.43).
Anchote starch, Characterization, Functional property, Optimization, Yield
Starch is an important ingredient in food industries because of its ease of production in high amounts, availability and low cost. Non-food manufacturing industries such as pharmaceuticals, plastic, textiles can also use starches as their raw material (Babu SA, 2014).
Starch can be produced from different crops such as cereals, tubers, roots and legumes. Cereals contain (40%-90%) of starch followed by tubers (65%-85%). Root crops also contain (30%-70%) starch. Legumes contain a lower amount of starch (25%-50%). Wheat, maize, rice and sorghum are vital sources of starch. Tuber crops are the second source of starch. Potato sweet potato, cassava and yam are main starch source tuber crops dominantly used as a human being’s food in Africa (Abegunde OK, 2012).
Anchote is an indigenous and underutilized tuber crop in the western part of Ethiopia. The name is originated from afan oromo and is pronounced as anchootee. It belongs to the family Cucurbitaceae particularly known in Kellem-Wollega, western Wollega, eastern Wollega, Illu Abba-Boora and Jimma. It is a drought resistance tuber crop that is stored underground pit, available when another crop is not adequate. It is used as cultural food in these areas especially during ceremonies and holidays such as new year celebration, meskel festival and wedding. It is also consumed as fasting food when animal product is not allowed. The producer and local society also use of anchote as herbal medicine. Some recent studies report that anchote (Coccinia abyssinica) contains good amounts of minerals such as calcium, iron, phosphorus and zinc. Anchote is a good source of edible starch next to potato.
Adding of anchote flour to wheat flour in the production of bread can improve the nutritional quality of the bread. It can also represent the dependence of wheat flour which imported and will save the foreign currency for the country (Adebayo A, 2010). Anchote starch and flour address the nutritional shortage challenges in wheat breads such as dietary fiber, protein and minerals. Although, it is used locally for different food purposes without mixed or mixed with other food materials such as spices. For examples anchote paste, anchote soup, anchote slice, anchote juice, etc. Anchote contains a high amount of dietary fibres which has benefit of physiological effects to the human body, as they stimulate and accelerate intestinal contraction and transit (Ammar BA, 2018).
The extraction of starch from anchote is one of an interesting area to increase the demand of the crop. Therefore, research towards extraction of anchote (Coccinia abyssinica) starch and optimization of the yield by studying the effect of extraction method on the yield, physicochemical and functional properties of the starch was studied.
Experiment location
The experiment was conducted at the laboratory of department of post-harvest management, collage of agriculture and veterinary medicine, Jimma university and laboratory of the department of material science and engineering, Jimma institute of technology, Ethiopia (Aulton ME, 2001).
Material
Fresh and non-defected anchote tubers were bought from the local market in Nekemte city, Ethiopia. The tubers were stored in a plastic bag to avoid moisture loss during storage prior to processing and analysis in the laboratory of the department of post-harvest management, collage of agriculture and veterinary medicine, Jimma university (Benesi I, 2004).
Starch extraction
Anchote starch was extracted according to the method described by with some modification. Fresh anchote tubers were thoroughly washed to remove surface soil, peeled and cut into small pieces of about 1 cm cubes. The small cubes were pulverized in high-speed blender into pulp. 1:5 v/v ratios of pulp to different concentration of chemicals solutions (0.50%, 1% and 1.50% concentration of sodium chloride, 0.50%, 1% and 1.50% concentration of sodium metabisulphite and 0.50%, 1% and 1.50% ammonia) and water as control.
Then the mixture was stirred for 5 minutes and filtered with a double folded cotton cloth (Arhewoh M, 2016). The filtrate was allowed to stand for 2 hours for settling the starch and the supernatant was discarded. Then the respective solutions and water was added to the starch, stirred for 5 minutes and stand for 2 hours to remove the residue of the non-starch materials.
The supernatant was discarded and the starch sediment was collected. The resulting starch was dried at 40°C in the oven dryer overnight (12 h). Finally, the dried starch was milled to a fine powder using a laboratory grinding machine and packaged with polyethylene bags for analysis (Demelash HM, 2016).
Identification test
The starch identification test was described by the iodine test. The solubility of the starch in cold water and alcohol (%) was also done. 1 g of starch powder was added to 2 ml of distilled water and mixed to prepare a homogenized mixture. 15 ml of boiling water was added and gently heated for 2 minutes. The iodine test is observed as any change in colour as the slurry changed into jelly as well as further change during cooling of the slurry as iodine solution added.
Physicochemical properties of anchote starch
Physicochemical properties such as moisture content and dry matter of anchote starch were determined by the method. Ash content, crude protein and crude fat contents were determined by the method of AOAC (2000). The pH of anchote starch was measured by using digital pH meter (pH meter pH-016) according to the method described. 1% w/v of the starch sample was dispersed into distilled water, mixed for 5 min and the pH value was noted (Fakir MSA, 2012).
The titrable acidity of anchote starch was determined as per the procedure. 1 g starch powder was diluted with 20 ml of distilled water and mixed gently to uniform dispersion. Then starch dispersion was titrated against 0.1 N NaOH using phenolphthalein as an indicator (Girma A, 2015).
Total carbohydrate contents of anchote starch were determined with standard method AOAC (2000). The amylose content of the starch was determined according to the method described by with some modification. 0.1 g of starch sample was added to the flask. 1 ml of 96% ethanol and 9 ml of 1 M NaOH were added. Heat is applied to solubilize the mixture on a boiling water bath for 10 minutes. 10 ml of distilled water was added to 1 ml of the solubilized mixture. Then 0.5 ml of the diluted mixture was transferred to 0.1 ml acetic acid (1 M) and 0.2 ml of iodine test solution (0.2 g I2 + 2.0 g KI in 100 ml of distilled water). 10 ml of distilled water filled, the dark-blue solution was formed and kept for 20 minutes until the development of the colour completed. The absorbance of the solution was read on UV-spectrophotometer after overtaxing the solution for 5 minutes. As standard corn starch with 70% amylose was used to estimate the amylose content of anchote starch as the following equation (Habtamu FG, 2014).
The amylopectin ration can be calculated by the following formula.

Bulk properties such as bulk density, true density and tapped density were determined by the procedures described (Hong Y, 2016).
Bulk density of the starch was determined by filling 25 g of starch sample to 50 ml graduated glass cylinder and weighing on the balance. Then, bulk density is expressed as the ratio of mass (g) of the starch sample to volume occupied by the starch (ml) (Hoover R, 2001).
Tapped density of the starch powder was determined by adding 25 g of starch sample into a 50 ml graduated glass cylinder, tapped 50 times on a bench and the respective volumes recorded (Jayakody L, 2007).
The true density of the starch was determined by the liquid displacement method. 1 gm of starch powder was added into a 25 ml graduated measuring cylinder containing 5 ml of toluene. The true density of the starch (g/ml) was expressed as the ratio of the weight (g) of the starch to the displaced volume (ml) of toluene.
Carr’s index and Hausner ratio were determined from the result obtained for bulk density and tapped density (Jobling S, 2004).
Crystallinity of starch
The crystallinity of the starch was expressed as x-ray powder diffraction taken with x-Ray diffractometer (XRD-7000). The diffractometer operated at the 2θ modes. The Cu target tube operated at 30 Kv (25 mA) in the range of 10-30 of 2θ angle with single-crystal graphite monochromatic equipped with a microprocessor to analyse peak position and intensities. Measurements were made at room temperature and the resulting X-ray diffraction pattern and peak positions were analysed graphically by using the OriginPro 2019 software. The crystallinity of the starch was determined by the peak positions.
Starch purity
The purity of starch extracted from the anchote tuber was estimated using the following relation:
Functional properties of anchote starch
The Water Absorption Capacity (WAC) and Oil Absorption Capacity (OAC) of anchote starch was determined according to the method described with little modification. 2 g starch sample was added into centrifuge tubes. 20 ml of distilled water/oil was added and mixed well by shaking for 5 minutes on the shaker. The mixture was centrifuged at 1500 rpm for 30 min and the supernatant was discarded. The tube was allowed to drain at 45° angle for 10 min. The swelling power and solubility index of the starch powder was determined according to the method described. 10 ml of distilled water and 2 g of starch powder were added to a centrifuge tube. The mixture was heated at 30°C, 50°C, 70°C and 90°C in a water bath for 30 min.
The samples were cooled to room temperature and centrifuged at 3000 rpm for 15 minutes and the supernatant was drained to pre-weighed petri-dish for the solubility index determination. The mass of the swollen starch was noted and the swelling power of the starch was determined. Finally, the supernatant was dried for 5 hours at 105°C in the oven dryer and the solubility of the starch was calculated.
Experimental design and data analysis
The experimental design and data analysis were performed by design expert 11.1.2.0 (State-Ease Inc., Minneapolis, MN, USA) software using Response Surface Methodology (RSM). Two independent factors and three levels were used as effective factors: One categorical factor (type of chemicals) and one numerical factor (concentration). Both have three levels.
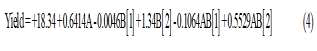
Type of chemicals (namely: Sodium chloride, sodium meta-bisulphite and ammonia) and concentration (0.5%, 1% and 1.5%). The dependent variable (response variable) was the yield (%) of extracted anchote starch. Each level has two replications and 14 runs were selected by D-optimal design. The following second-order polynomial model was used to describe the relationship between the two independent variables and the response variable.

Where, Yi is the predicted response; b0 is an intercept; b1 and b2 are the estimated coefficients of centrifugal speed (X1) and time (X2), respectively; b11 and b22 are quadratic effects; and b12 is interaction effect of independent variables.
Starch yield optimization
Table 1 shows the experimental values of extracted anchote starch. 2FI model was suggested to determine the significance of the results at (p<0.05).
The maximum starch recovered from anchote tuber was 20.86% in 1.5% concentration of sodium chloride solution and 16.71% for control Table 1. The starch yield on a Dry Weight Basis (DWB) of anchote tuber is 67.82% and 55.07% for 1.50% concentration of sodium chloride solution and control respectively (Table 1).
| Run | Factor 1 A: Concentration (%) | Factor 2 B: Type of chemical | Response 1 yield (%) |
|---|---|---|---|
| 1 | 0.5 | Na2S2O4 | 17.83 |
| 2 | 0.5 | NH3 | 16.81 |
| 3 | 1.5 | Na2S2O4 | 18.9 |
| 4 | 1.5 | NH3 | 17.32 |
| 5 | 1.5 | NH3 | 17.12 |
| 6 | 1 | NaCl | 19.61 |
| 7 | 1.5 | NaCl | 20.86 |
| 8 | 1 | Na2S2O4 | 18.28 |
| 9 | 0.5 | NH3 | 16.85 |
| 10 | 0.5 | NaCl | 18.56 |
| 11 | 0.5 | NaCl | 18.39 |
| 12 | 1 | NH3 | 16.93 |
| 13 | 1 | Na2S2O4 | 18.32 |
| 14 | 1 | NaCl | 19.75 |
Table 1. The experimental values using D-optimal design of anchote starch yield (%).
This indicates that the addition of chemical solution can remove Non-Starch Polysaccharide (NSP) and proteins which reduce the yield and purity of the starch. NaCl solution can increase the yield of starch by breaking the bond between starch and protein molecule. Starch-protein association broken down the starch molecules were settled down by gravity and the protein molecules were floating as a supernatant (Table 2).
| Source | SS | DF | MS | F-value | p-value | Significant/not significant |
|---|---|---|---|---|---|---|
| Model | 19.49 | 5 | 3.9 | 542.65 | <0.0001 | significant |
| A-Concentration | 3.07 | 1 | 3.07 | 426.72 | <0.0001 | - |
| B-Type of chemical | 16.04 | 2 | 8.02 | 1116.12 | <0.0001 | - |
| AB | 1.65 | 2 | 0.8263 | 115.02 | <0.0001 | - |
| Residual | 0.0575 | 8 | 0.0072 | - | - | - |
| Lack of fit | 0.0116 | 3 | 0.0039 | 0.4225 | 0.7453 | not significant |
| Pure error | 0.0458 | 5 | 0.0092 | - | - | - |
| Cor total | 19.55 | 13 | - | - | - | - |
| Note: SS=Sum of Square; DF=Degree of Freedom; MS=Mean Square | ||||||
Table 2. ANOVA for response surface 2FI model for anchote starch yield.
From Table 2 the suggested model was highly significant with a p-value of <0.0001. Sodium chloride is the best chemical solution with a concentration of 1.5%.
The yield of the starch was increasing with increasing concentration of the solution to 1.5%. The F-value of lack of fit is 0.4225 which implies non-significant when compared to the pure error and the suggested model was adequate.
The interaction between the variable was also significant (p<0.05).
The (R2) has a value of 0.9971. Therefore, there was a good agreement between experimental and predicted values (Table 3).
| Source | Std. dev. | R2 | Adjusted R2 | Predicted R2 | PRESS | Suggested/Aliased |
|---|---|---|---|---|---|---|
| Linear | 0.4135 | 0.9125 | 0.8863 | 0.8122 | 3.67 | - |
| 2FI | 0.0848 | 0.9971 | 0.9952 | 0.9907 | 0.1825 | Suggested |
| Quadratic | 0.0862 | 0.9973 | 0.9951 | 0.9898 | 0.1996 | - |
| Cubic | 0.0958 | 0.9977 | 0.9939 | - | * | Aliased |
Table 3. Model summary statistics.
The optimum conditions of anchote starch yield were determined by two-dimensional (2-D) plots as Figure 1. The interaction plot indicates the effect of the independent variables and their interaction on the response variable. It indicates the yield of anchote starch was increased with the concentration of NaCl to 1.5%. The optimum concentration for maximum anchote starch yield was NaCl with 1.50% concentration (Figure 1).

Figure 1. Response surface plot showing the effect of extraction media on the anchote starch yield (%).
Development of regression model equation
The results showed the yield of starch extracted from anchote tuber depend on both independent variables and the interaction of the variables. The response variable depends on the concentration of sodium chloride. Sodium chloride at the concentrations of 1.50% had the optimum yield. This may be due to the capability of sodium chloride solution to release the non-starch molecules from the surface and free the starch molecules to settle. Also, it can breakdown the starch-protein bond and the protein molecules easily removed from the starch.
Final equation in terms of coded factors for anchote starch yield
Where; A=concentration (%) and B=type of chemical
Final equation in terms of actual factors for anchote starch yield
Type of chemical: NaCl (Table 4).
| Number | Type of chemical | Concentration | Yield | Desirability | |
|---|---|---|---|---|---|
| 1 | NaCl | 1.5 | 20.867 | 1 | Selected |
| 2 | NaCl | 1 | 19.673 | 0.707 | - |
| 3 | Na2S2O4 | 1.5 | 18.867 | 0.508 | - |
| 4 | NaCl | 0.5 | 18.479 | 0.412 | - |
| 5 | Na2S2O4 | 1 | 18.332 | 0.376 | - |
| 6 | Na2S2O4 | 0.5 | 17.797 | 0.244 | - |
| 7 | NH3 | 1.5 | 17.147 | 0.083 | - |
| 8 | NH3 | 1 | 16.982 | 0.042 | - |
| 9 | NH3 | 0.5 | 16.817 | 0.002 | - |
Table 4. Solutions for 9 combinations of categorical factor levels.
Physicochemical properties of starch
The moisture content of starch was 12.14%. This result was found in the recommended range (10%-15%) of moisture content for root and tuber starches. The safe storage life of some starches is <13% for some starch producing countries.
The ash content of anchote starch isolated with 1.5% NaCl solution was 0.30%. Total ash content is directly proportional to the inorganic element content of the tuber.
The upper limit of ash content recommended by the British pharmacopeia is 0.6% w/w. Ash level may also be regarded as a measure of the quality or grade of the starch and often a useful measure in identifying the validity of food. It can also measure the mineral status of a starch.
The fat content of anchote starch isolated was 0.04 for 1.5% NaCl solution. The fat content of the root and tuber crop is very small or negligible. The fat/lipid content of anchote starch is in the range of typical root or tuber starch 0.05%-0.1%.
The total fiber content of anchote starch isolated with 1.5% NaCl solution was (1.64%). Fiber content in food have an advantage in food such as hypoglycaemic and hypocholesterolaemia activity. A higher amount of the fiber and ash is an indication of poor quality grade of the starch FAO (2000).
The protein content of anchote starch extracted was 0.53%. Protein is an important component of food material. High protein content has an adverse effect on starch characteristics such as the water absorption capacity of the starch molecules and granule surface and gelatinization.
The total carbohydrate content of the starch was 85.35. It is an important characteristic of starch which is indirect measure starch purity. Higher content of carbohydrate shows the good quality for starch.
The purity of starch shows the percentage of total carbohydrate content free of moisture content found in the starch. The purity of anchote starch is 97.09% and 97.14% for control and 1.5% NaCl solution respectively.
The pH is an indication of the alkalinity or acidity of the starch. It affects the performance of the starch in food processing applications. The pH value of anchote starch extracted with control and 1.5% NaCl solution was found 7.25 and 7.32 respectively. Thus, the pH values of the starch obtained in this study in agreement with the standard pH of alkaline treated starches 5.0-7.5 FAO (2000).
The titratable acidity of anchote starch extracted with control and 1.5% NaCl solution was found 0.158% and 0.160% respectively. The titratable acidity is an indicator of freshness in the starch (Table 5).
| Chemical properties | Anchote starch | |
|---|---|---|
| Control | NaCl (1.5%) | |
| Moisture content (%) | 12.31 | 12.14 |
| Ash content (%) | 0.25 | 0.3 |
| Fat content (%) | 0.05 | 0.04 |
| Fiber content (%) | 1.63 | 1.64 |
| Protein content (%) | 0.62 | 0.53 |
| Total carbohydrate (%) | 85.14 | 85.35 |
| Amylose content A.C (%) | 17.18 | 17.42 |
| Amylopectin (%) | 82.82 | 82.58 |
| Starch purity S.p (%) | 97.09 | 97.14 |
| pH | 7.25 | 7.32 |
| Titratable acidity (%) | 0.158 | 0.16 |
Table 5. Physicochemical properties of anchote starch.
The amylose content of anchote starch for control and 1.5% NaCl solution was 17.18% and 17.42% respectively. There is significance (p<0.05) different between amylose content of starch isolated with control and 1% NaCl solution. This result shows that anchote starch contains a lower amylose/amylopectin ratio and it can be used as disintegrant and thickener.
Bulk properties of the starch
A flow characteristic of the starch powder is very important for industrial operations like mixing, transportation, and packaging. Bulk density, tapped density, true density, Carr’s index and Hausner ratio of the starch was discussed.
Anchote starch granules results in bulk density of 0.47 and 0.46, true density 1.52 and 1.50 and tapped density 0.68 and 0.65, Carr’s index 24.24 and 23.97 and Hausner ratio 1.33 and 1.32 for control and 1.5% NaCl solution respectively. Starches with higher density have high diluent power. This can reduce the volume of the starch granule and improve the association and flow (Table 6).
| Bulk properties | Starch | |
|---|---|---|
| Control | 1.5% NaCl | |
| Bulk density (g/cm3) | 0.47 | 0.46 |
| True density (g/cm3) | 1.52 | 1.5 |
| Tapped density (g/cm3) | 0.68 | 0.65 |
| Carr’s Index (CI) | 24.24 | 23.97 |
| Hausner Ratio (HR) | 1.33 | 1.32 |
Table 6. Bulk properties of the starches.
Carr’s index and Hausner ratio of anchote starch were 23.97 and 1.32 respectively. Carr’s index is the prediction of the starch compressibility and the value above 23% was an indication of low compressibility. The Hausner ratio of the starch shows the flow property of powders and the value above 1.2 was an indication of low flow property of the granule (Muazu et al., 2011). Carr’s index is a simple test to evaluate bulk and tapped densities of the powders and the rate at which they are packed down. HR indicates the flow properties of the powder.
Crystallinity of starch
Crystallinity of the starch is an indication of the order structure of amylopectin molecules inside the granule. The x-ray powder diffractogram of anchote starch was shown in Figure 6. Starch having different crystallinity pattern have different packing arrangements (Hong et al., 2016; Moorthy, 2002). Depending on their diffraction pattern starches can be divided into three categories. A-type starches are cereal starches having strong diffraction peaks at about 15° and 23° of 2θ angle and an unsettled doublet at around 17° and 18° of 2θ angle. B-type starches are tubers and high amylose starches which exhibit the strongest diffraction peak at around 17° of 2θ angle and a few small peaks at around 15°, 20°, 22° and 24° 2θ angle. The C-type starches were legumes, roots and some fruit starches which show the property of both A and B-type (A. Surendra, Parimalavalli, 2014). The crystallinity of the starch powder was measured by X-ray diffractograms (model XRD-7000). XRD is used for the investigation of powder crystal structures at the atomic level. The x-ray patterns of anchote starch show the diffraction peaks at 15.5°, 17.2°, 22° and 24.2° of 2θ angles for both control and 1.5% NaCl solution. This similarity shows the extraction method con not affect the crystallinity. Both results of starch showed the sharp strong diffraction peak at 17° 2θ of angles and few small peaks at 2θ values of 14.5°, 15.5° and 19.5°. The previous work of (A. Surendra and Parimalavalli, 2014) report that potato starch showed diffraction peaks with 2θ values of 17°, 22° and 24° and sweet potato starches showed peaks at the 2θ diffraction angles around 10°, 11°, 15°, 17°, 20° and 23°. From these observations, anchote starches revealed a B-type diffraction pattern that is comparable with potato starch. This result shows that the isolation method did not affect the diffraction pattern of anchote starch. A-type starches show higher levels of crystallinity and higher gelatinization temperatures whereas B-type starches show lower levels of crystallinity and lower gelatinization temperatures (Table 7 and Figure 2).
| Anchote starch | Strongest peaks | |||||||
|---|---|---|---|---|---|---|---|---|
| Peak 1 | Peak 2 | Peak 3 | Peak 4 | |||||
| angle (2θ°) | Intensity | angle (2θ°) | Intensity | angle (2θ°) | Intensity | angle (2θ°) | Intensity | |
| Control | 15.5 | 1274 | 17.2 | 1590 | 22 | 1190 | 24.05 | 1054 |
| NaCl | 14.52 | 1263 | 17.12 | 1470 | 21.64 | 1108 | 24.24 | 947 |
Table 7. X-ray diffraction data of the anchote starches.

Figure 2. X-ray diffractograms of anchote starch.
Functional properties of starch
Water Absorption Capacity (WAC) of anchote starch was 0.16 and 0.17 ml of water/g starch for control and 1.5% NaCl solution respectively. Water absorption capacity is influenced by the protein content of the starch. It is an indication of protein-water interaction in food. Higher water absorption capacity results in weak interactive forces of the starch component. Water absorption capacity is maybe due to the loose structure of starch and removal of fat exposes the water binding sites of amino acids. The oil absorption capacity of anchote starch was 0.15 ml and 0.17 ml of oil/g starch for control and 1.5% NaCl solution. OAC is affected by the protein content of the starch. Protein contains both hydrophilic and hydrophobic parts. The hydrocarbon chains of lipids can form hydrophobic interaction with non-polar amino acid side chains. WAC and OAC can express the industrial interest of the starches in the formulation of food products (Table 8).
| Properties | Starch samples | |
|---|---|---|
| Control | NaCl | |
| WAC (ml/g) | 0.16 | 0.17 |
| OAC (ml/g) | 0.15 | 0.17 |
Table 8. WAC and OAC of anchote starches.
Swelling power and solubility index of the starch was tested at different range of temperatures from 30°C-90°C (30°C, 50°C, 70°C and 90°C). As temperature increase to 90°C, both swelling power and solubility of the starch increase. The swelling power can be affected by the protein content of the starch. When starch suspension in water was heated, the hydrogen bonds of the starch breakage and its crystalline structure disrupted. The hydrogen bonds linked to exposed hydroxyl groups of amylose and amylopectin. This can cause an increase in starch granule swelling power and solubility (Table 9 and Figures 3,4).
| Temperature (°C) | Starch | |
|---|---|---|
| Control | NaCl | |
| 30 | 1.91 | 1.9 |
| 50 | 2.54 | 2.53 |
| 70 | 8.11 | 8.1 |
| 90 | 11.66 | 11.65 |
| 30 | 0.32 | 0.31 |
| 50 | 0.91 | 0.9 |
| 70 | 4.8 | 4.81 |
| 90 | 15.42 | 15.43 |
Table 9. Swelling power and solubility of anchote starch at different temperature.

Figure 3. Swelling power plot of anchote starch at different temperature.

Figure 4. Solubility plot of anchote starch at different temperatures.
The study revealed that the optimum yield of the starch was produced with 1.5% NaCl solution which was 20.86% fresh weight basis or 67.82% dry weight basis. The physicochemical and functional properties study has shown that anchote starch is promising alternative source for food applications. The proximate compositions such as moisture content, ash content, fat content, protein content and total carbohydrate contents were within the standard range indicated by different studies. Anchote starches have shown a B-type diffraction pattern. Therefore, anchote can be used as a source of starch for different food and pharmaceutical applications.
The author(s) would like to thank the Ministry of Science and Higher Education (MoSHE), Ethiopia for financial support and Jimma university for provision of lab facility.
The lab work for this study was fully executed by Gudeta Shuma at Jimma university laboratories while the design of the study, analysis and interpretation of the data and preparation of the manuscript was done together with Baba Abdissa.
[Crossref] [Google Scholar] [PubMed]
[Crossref] [Google Scholar] [PubMed]
Citation: Shuma G, et al. (2023). Extraction, Optimization, and Characterization of Starch from Anchote Tuber. IRJPS. 09: 106.
Copyright: © 2023 International Research Journals. This is an open access article distributed under the terms of the Creative Commons Attribution License, which permits unrestricted use, distribution, and reproduction in any medium, provided the original work is properly cited.