Research Article - International Research Journal of Biotechnology ( 2025) Volume 16, Issue 1
Received: 30-May-2024, Manuscript No. irjob-24-137640; Editor assigned: 03-Jun-2024, Pre QC No. irjob-24-137640 (PQ); Reviewed: 17-Jun-2024, QC No. irjob-24-137640; Revised: 08-Jan-2025, Manuscript No. irjob-24-137640 (R); Published: 15-Jan-2025, DOI: 10.14303/2141-5153.2025.99
Phosphorus (P) is one of the most essential macro-elements vital to increase soil fertility growth and development of plants. However, the occurrences of phosphorus in complex form make it in soluble and in accessible. Hence the objective of the present study was to isolate and characterize phosphate solubilizing bacteria from agricultural field soil sample of Afar region of Dupti wereda, and in south Gondar Zone Kimir-Dingay district Deskua kebele, and to assess their capability to solubilize phosphates This study was conducted from Institute of Biotechnology Department of biotechnology cellular and microbial laboratory in Gondar university. Thus, Phosphate solubilizing bacteria were isolated and characterized morphologically, biochemically. Total of ten phosphate solubilizing bacteria were isolated from the selected site. The isolates were coded as DU1, DU2 DU3, DU4, DU5, DU6, DE1, DE2, DE3 and DE4. From these eight isolates were gram positive and two isolates were gram negative. Their phosphate solubilization efficiency of isolates were identified based on making hole zone or clear zone around PVK media. And liquid broth containing calcium triphosphate. Among the isolates. DU5=6 mm, DE1=6 mm and DE2=6 mm, DU1=5.6 mm have observed to be the maximum solubility index. When solubilization efficiency of isolates observed in liquid broth the highest P release were recorded by isolates DE1=2.16 ± 1.96 mg, DU5=1.01 ± 1.02 mg, DE2=0.907 ± 1.25 mg, DE4=0.7 ± 0.9 mg. Based on solubilization efficiency and stress tolerant capability only six isolates were selected for pot experiment applied in faba bean and wheat variety. Isolate PSB DU5 showed the best effect on shoot length (71.66 ± 15.27), root length (12.66 ± 3.7), leaf number (39 ± 4.35), nod number (13.3 ± 0.57) Isolate PSB DU1 and PSB DE1, DE2 showed second and third best effect on shoot length of Dosha faba bean growth respectively. Similarly, PSB DU3 significantly increased root length When the effect of the isolates is compared based on their shoot length of the inoculated Eliodoro wheat variety, isolate DU1 and DU5 were observed to be the most effective to enhance the plant growth with respect to shoot length.
Phosphorus, Plants, Agricultural field, Morphologically, Calcium triphosphate
Now day’s soil fertility is decreasing from time to time because of continuous cropping to fulfill the rapidly growing world population food demand (Setargie A et al., 2015). As a result, agricultural lands are expanding with the expense of forests. Land degradation and soil fertility decline in Africa are deeply complex with intertwining and cyclical causes (Alori ET et al., 2017). Specially, in highly populated areas such as southern Sudan, Ethiopia, and western Kenya due to continuous use without external inputs, the fertility of the land has decreased and depleted severely (Araujo AS et al., 2012).
Phosphorus (P) is one of the most essential macro-elements vital to growth and development of plants (Bairdâ?Parker AC, 1974). It is major growth limiting nutrients next to nitrogen (Begum K et al., 2017). Most (95-99%) of Phosphorus in soil is present as insoluble organic and inorganic phosphates which are released into the soil slowly (Brady NC, 1990). The availability of inorganic phosphate in the soil are in complex form such as; ferric phosphate, calcium phosphate and aluminum phosphate (Castango LM et al., 2011). Whereas, organic phosphates are found in the form of dipotassium hydrogen phosphate, potassium, hydrogen phosphateinositol hexa phosphate and glycerol pliosphate. Even though Phosphorus is important for several key functions of plants including root development, stalks and stems strength, flower and seed formation, and crop maturity, the occurrence of phosphorus in complex form make it insoluble and inaccessible for plants (Cheesbrough M, 1993). This in turn affects both soil composition and crop production. Of course, soil fertility can be improved using chemical fertilizers that increase crop productivities (Chen YP et al., 2006). However, it greatly damages the environment and causes harmful impacts on living organisms’ health, and changes soil properties (Chaiharn M et al., 2009).
In Ethiopia the population number is increasing with high rate which impose increased demand of food (Datta M et al., 1997). As a result, there is high demand of agricultural land and modern agricultural inputs for food security. However, due to urbanization, industrialization, over ploughing and climate change the soil quality is declining at an alarming rate (Davies JA et al., 1983). As it is known, Ethiopia is an agrarian country and substantial effort is being made to increase crop productivity so as to feed the growing human population (Duquesne S et al., 2007). However, the amount of money that Ethiopia spent to import chemical fertilizers is high (Fasim F et al., 2002). Moreover, the transaction and transportation costs of chemical fertilizers make it costly in addition to the environmental impact of chemical fertilizers. Transport costs alone account for 64–80% of these price differentials. That amount of money should be saved by replacing with bio-fertilizers like phosphate solubilizing bacteria isolated from local environments (Getaw A et al., 2018). Hence, it is possible to increase soil fertility and crop productivity by using different microbes, like phosphate solubilizing bacteria as bio fertilizers and replace chemical fertilizer which cause environmental hazard (Glick BR, 1995). This is the motive of this thesis work since there is no published work done in similar scenario to the best of my knowledge in the study area (Gowsalya A et al., 2014).
Screening of potential phosphate solubilizing bacteria as bio fertilizer can be replace chemical fertilizers, save money that has been invested to import chemical fertilizers and maintain environment healthy and remove soil acidity associated with utilization of chemical fertilizers (Gupta R et al., 1994). Moreover, these PSB can be used in farming system and plays significant role to increase farmers’ productivity to feed the steadfast growing human population in Ethiopia (Ingle KP et al., 2017). Thus, the major beneficiary of such study is the nation in general, farmers, researchers, policy makers and all individuals in particular (Ivanova R et al., 2006).
The objective of the present study was to isolate and characterize phosphate solubilizing bacteria from Afar region and Amhara region south Gondar (Kimr-Dingay, Amhara region) and Dupti kebele (Afar region) agricultural soil sample to determine their effect to promote the growth of legume and non-legume crops and evaluate the effectiveness of the screened isolates on growth of selected crops (wheat and faba bean).
Study area
This study was conducted in Dupti kebele in Afar Region, Ethiopia. It is located at the eastern end of the Afar Region Capital, Semera, Ethiopia. This district is characterized by high humidity and temperature, which range between 27°C to 45°C. The district has one urban and eight rural Peasant Associations (PAs), of which three (Alasa Bolo, Humodoyeta and Mego) are totally agro-pastoralist PAs. The elevation of the district is between 280–850 meters a.s.l., with an average annual temperature of 120 mm. The land coverage of the district is about 1926 km 2 and the district is known by Lake Abbi, which is the final destination for the Awash River.
Kimir-Dingay district is one of the study area included in this study. It is located in South Gondar Administrative Zone of the Amhara National Regional State, Ethiopia. It is at about 100 km north of the Regional Capital- Bahir Dar and 660 km north of the Addis Ababa. The total area of the Woreda is 109,925 hectares. According to CSA, Deskua kebeleis one of the kebele from this Woreda and located at Latitude: 12° 00' 0.00" N, Longitude: 38° 00' 0.00" E (Figure 1).

Figure 1. Map of study area.
Sampling site selection
The study sites were selected based on the general facts that areas incorporated as a study site are believed to be affected by different environmental factors such as, salinity and acidity. Prior to the opening of soil profiles, personal field observation of the selected agricultural study areas was carried out to determine which specific areas should be selected as representative sites of the study area on the basis of salinity, acidity and high temperature. Moreover, the sampling site selection was done based on cropping history of lands and the possibility of occurrences of phosphate solubilizing microbes. Accordingly, two representative soil sampling sites for each study site were selected randomly with similar cultivation histories.
Study design and study period
The study was conducted from October 2019-June 2020. Experimental design was used to conduct this study. Pots were arranged in a Complete Random Block Design (CRBD).
Soil sample collection
In each sampling sites 100 g surface soil sample (0 to 30 cm depth) was collected from Deskua kebele (acidic soil) and Dupti kebele (saline soil and high temperature). Each surface soil sample was collected with sterilized plastic bagsfrom a plot size of 25 m by 25 m from the land area represented by the respective soil profile. The representative study sites are
From these sites soil samples were collected with sterilized plastic bag and transported to University of Gondar for phosphate solubilizing bacteria isolation, screening and characterization.
Soil sample analysis
In this study, physico-chemical analysis of the soil samples, such as pH, CEC (Cation Exchange Capacity), electrical conductivity, macro-elements (total nitrogen and organic matter, phosphors, potassium, sodium, magnesium and calcium) were analyzed. Soil analysis for the aforementioned physico-chemical parameters was done at Gondar Agricultural Research Center according to Richards. The availability of phosphorus, potassium, total nitrogen and organic matter, sodium, magnesium and calcium analysis were done based on standard soil analysis methods.
Isolation of phosphate solubilizing bacteria
1 gram of soil from each sample were serially diluted from 10-1 up to 10-7. From dilutions of 10-5, 10-6, 10-7 0.1 ml of suspension were takenand inoculated onto o Pikovskayas’s agar medium according to Pikovskaya. The bacteria were isolated and screened on Pikovskayas’s medium which consists of: (Glucose 10 g, Magnesium sulphate 0.1 g, Ferrous sulphate trace, Manganese sulphate trace, Tricalcium phosphate as P source, agar 15 g, distilled water 1L, pH was adjusted to 7 before sterilization, followed by pour plate technique and incubated at 30°C for 48 hr., discrete colonies showing halo zones were picked up and sub cultured in Nutrient agar slants and preserved. The isolates were also characterized based on the colony morphological characteristics (i.e., shape, color, and elevation margin of bacterial colony) on their respective plate and gram staining. Further identification of isolates was done by using various biochemical tests.
Biochemical characterization of phosphate solubilizing bacteria
Growth on Glucose Peptone (GP) Agar medium: Glucose peptone agar medium was used to identify the ability of the bacterial isolates to utilize glucose as the sole carbon source. The GPA medium (containing 40 g glucose, 5 g peptone and 15 g agar in 1L water) was prepared and the pH was adjusted to 6.7. Then 0.1 ml of bacterial suspension was inoculated. After inoculation, the petri dishes were incubated at 300c for 4 days. The presence of growth was recognized as positive for glucose utilization.
Congo red Yeast Extract Manitol Agar (CRYEMA) medium: Yeast Extract Mannitol Agar (YEMA) medium containing congo red 2.5% congo red dye per 1L of YEMA solution was prepared and adjusted at pH of 6.7. Then 0.l ml of bacterial suspension was spread on the plate and the inoculated plates were incubated at 30°C for 4 days. Then after, the growth of bacteria was positive this test.
Methyl Red and Voges Proskauer test: A glucose phosphate broth medium (containing 5 g glucose, 5 g peptone and 5 g K2HPO4 in 1L distilled water) was prepared in test tubes. The tubes were inoculated with 0.1 ml of bacterial suspension and incubated for 3 days at 30°C. After that for Methyl Red (MR) test 5 drops of the indicator (0.1 g methyl red in 300 ml of ethanol+200 ml distilled water) were added to each culture tube. And for the voges-proskauer test, 5 drops of the indicator (0.6 ml of 5% Alfa nepthol in absolute alcohol and 0.2 ml of 40% potassium hydroxide) were added. This test is used to identify pyruvic acid metabolizing capacity of the bacteria.
Triple Sugar Iron (TSI) agar test: Triple sugar iron agar media consisted of (1 g dextrose, 3 g yeast extract, 15 peptone, 3 g beef extract, 5 g NaCl, 10 g lactose, 10 g sucrose, 0.2 g ferrous sulphate, 0.3 g sodium thiosulfate, 0.24 g phenol red, 15 g agar per liter of distilled water) was prepared in test tubes and the final pH was adjusted to pH of 7. Each test tubes were inoculated with 0.1 ml of bacterial suspension and incubation at 35°C for 3 days. The color on the butt and the slant and production of acid, CO2 and hydrogen sulphied were recorded to determine the capability of bacterial isolates to utilize various carbohydrate sources (sucrose, glucose, lactose).
Simmon’s citrate agar: This test was used to identify the organisms capable of using citrate in Simmons Citrate Agar as the sole carbon source and metabolize the ammonium salt in the medium. The increment of pH of the medium and development of color change in the bromothymol blue indicator was considered as positive for the utilization of citrate and growth of bacterial isolate on Simmons Citrate Agar.
Urease production test: For this test a differential medium (10 g peptone, 10 g dextrose, 12 g disodium phosphate, 8 g potassium dihydrogen phosphate, 50 g sodium chloride and 0.12 g phenol red in 1L of distilled water) was boiled, steam sterilized at 121°C for 15 minute and left to cool. Following, 50 ml 40% filter sterilized urea solution was added to the cooled test medium. 0.1 ml of bacterial suspension was inoculated after inoculation the cultures were incubated for 3 days at 30°C. This test is used to test the ability of an organism to produce an exo enzyme, called urease, which hydrolyzes urea to ammonia and carbon dioxide. If the urea in the broth is degraded and ammonia is produced, an alkaline environment is created, and the media turns to pink.
Indole test: The indole test medium (20 g tryptone, 5 g lactose, 2.75 g dipotassium hydrogen phosphate, 2.75 g dihydrogen potassium phosphate, 5 g sodium chloride, and 7 g sodium lauryl sulphate in 1L distilled water) used was prepared in test tubes. Then each tubes were inoculated with 0.1 ml of aliquots bacterial isolates inoculated into the test tube and incubated for 3 days at 30°C. The ability of isolate to split indole from the amino acid tryptophan was observed by adding 5 drops of Kovac's reagent to the culture broth.
Motility test: For this test, a semi-solid nutrient agar was prepared with 0.5% agar concentration was in test tubes. Then a loopful of bacterial isolate were inoculated using agar stab method to the center of the tube from up to bottom using inoculating loop. All inoculated tubes were incubated at 30°C for 3 days. Diffused growth originated from the inoculated center zone to periphery of the tube was considered as positive for motility. Whereas growth only on the inoculated line was labeled as non-motile.
Catalase test: This test was performed to study the presence of catalase enzyme in phosphate solubilizing bacteria using H2O2 which would be converted into H2O and O2.
Determination of the isolates phosphate solubilizing capacity based on PVK culture media pH change
Phosphate solubilizing ability of the isolates were determined in terms of PH change in 7,10 and 15 day intervals of bacterial inoculated pvk culture media.
Phosphate solubilizing ability assay
As the plate assay is not considered a reliable method in determining a strain as phosphate solubilize, the pure cultures were further screened in liquid medium containing Ca3 (PO4)2 as insoluble P source. The isolated strains were grown in liquid medium and were shaken at 30°C for 20 h. sterile water-inoculated medium was treated as a control. Three Erlenmeyer flasks for statistical replication were used to incubate in the dark on a shaker at 30°C for 3 days. The supernatant of the medium was used to assess P released into the solution.
Phosphorus in the culture was determined by the molybdenum blue method with a spectrophotometer at a wavelength of 410 nm.
Estimation of phosphate solubilization efficiency
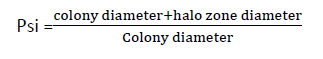
The solubilization efficiency of PSB to solubilize tri calcium phosphate on pikoviskayas agar medium was determined in terms of solubilization index (PSI). PSI was calculated by measuring the colony diameter and halo zone diameter, using the fallowing formula of Edipremono.
Screening of bacterial isolates for their stress tolerance capability
Screening for NaCl salt tolerance: Screening for different salt stress tolerance phosphate solubilizing isolates was tested on Nutrient broth with salt (5%, 10%, 15% and 20%) growth which was repeated three times. Further their salt tolerance was evaluated by growing each of the isolates on solid culture at 28°C for 48 hours. The growth of isolates at different concentrations of NaCl was then compared with the control.
Screening for temperature tolerance: Screening for temperature tolerance viz., all efficient isolates to promote plant growth were tested at different temperature (25°C, 28°C, 37°C, 40°C, 45°C) for two days. To do so, loop full culture of each isolates were inoculated in 5 ml broth tube and incubated at 280C for 48-72 hours. After this 100 μl broth cultures from each tube was spread on agar plate media and allow growing for 48-72 hours at 28°C.and then determine whether grow well or not Chaiharn and Lumyong.
Screening for pH tolerance: The pH stress tolerance of all the isolates were tested on solid media plate with pH (5.0, 6.0, 7.0, 8, and 9) by inoculating from log phase culture and incubating at 28°C for 48-72 hours.
Pot experiment
The phosphate solubilizing and growth promoting of isolates were determined using Dosha faba bean cultivar and Elio Doro weight variety collected from Amhara Regional Agricultural Research Institute, Gondar were used as a plant material. Then fourty eight Plastic pots, which measure 24.5 diameter and 20.5 cm depth were bought from the local market. And this pots were surface sterilized with 95% ethanol and rinsed with clean water. Soil sample for pot experiment was collected in Tewodros campus, University of Gondar, Gondar. And this soil samples were sterilized at 100ºC for 3 hours using dry hot oven. Each plastic pots were filled 7 kg of sterilized soil. Seeds were surface sterilized with sodium hypochlorite solution (0.5%) for three to four minutes and then washed in clean water for planting. Then each plastic pot was inoculated with surface sterilized four seeds of Dosha faba bean cultivar and eliodoro weight variety 4cm apart. After 10 days of planting the cultivars 300 ml, of bacterial isolate suspensions (standardized to 105 to 106 cfu ml-1) Nutrient broth media were inoculated in each pot. The media alone was used as negative control whereas chemical fertilizer (DAP) were used as a positive control. Inoculated pots were arranged in a completely randomized design. The pots were watered twice per week. The root and shoot growth were evaluated at the 45th and 60th, day of inoculation. The up rooted plantlets were also used to evaluated biomass and dry weight.
Data analysis
The data wereanalyzed using the SPSS software package version 22. Means and standard deviations of the triplicates analysis was calculated by one-way Analysis of Variance (ANOVA) to determine the significance differences between the means followed by Duncan’s multiple range test (P ≤ 0.5).
Physicochemical analysis of soil samples
The physicochemical analysis of soil samples revealed that, the two study areas have significantly different physicochemical profiles as indicated in Table 1. Phosphorus analysis indicated that the available of phosphorus (p/ppm) in the soil samples are almost similar except Deskua kebele.
The pH analysis of the study area soil indicated that the pH value of soil samples was ranged from 6.7 to 8.24 recorded from Deskua and Dupti Keble respectively. Similarly, Electrical Conductivity (EC) analysis of the study area showed that soil samples have significantly different electrical conductivity with lowest value 0.05 obtained from Deskua Kebele sample and highest value 1.13 recorded from Dupti Kebele soil sample.
Regarding macro-elements and organic matter analysis, the soil samples have different levels of organic matters and microelements. The organic matter content was ranged between 1.29-4.17% recorded from Dupti and Desekua soil sample respectively. Likewise, the concentration of macro-element such as calcium, potassium, sodium and magnesium is significantly different as shown in Table 1.
| Sample site | Soil analysis parameter | |||||||||
| pH | EC | OM% | Available P/ppm | TN% | CEC | Ca++ | K++ | Na+ | Mg++ | |
| Du1 | 8.24 | 0.69 | 1.44 | 2.87 | 0.07 | 43.87 | 30.92 | 2.02 | 4.63 | 5.56 |
| Du2 | 8.6 | 0.22 | 1.65 | 2.37 | 0.08 | 40.66 | 31.03 | 1.39 | 4.34 | 3.75 |
| Du3 | 8.55 | 0.2 | 1.37 | 2.08 | 0.07 | 41.09 | 30.17 | 2.15 | 4.51 | 4.17 |
| Du4 | 8.22 | 0.86 | 1.8 | 3.49 | 0.09 | 45.37 | 30.5 | 2.2 | 5.9 | 6.1 |
| Du5 | 7.97 | 1.13 | 1.29 | 2.2 | 0.06 | 44.3 | 29.1 | 1.93 | 4.95 | 6.74 |
| Des1 | 6.74 | 0.07 | 4.17 | 5.14 | 0.21 | 43.44 | 24.18 | 2.06 | 1.63 | 1.63 |
| De2 | 7.43 | 0.05 | 1.73 | 2.76 | 0.09 | 38.95 | 23.75 | 0.82 | 1.89 | 4.17 |
| De3 | 7.31 | 0.26 | 2.37 | 2.59 | 0.12 | 44.94 | 18.3 | 1.32 | 1.84 | 9.31 |
Table 1. Physicochemical analysis of soil samples.
Isolation and characterization of isolates
In the present study ten isolates have been isolated. Morphologically, most of the isolates were smooth, circular, transparent, spore formers and white colony as shown in Table 2. Three of the isolates designated as DU1, DU5 and DU6 are found non-spore formers. Whereas the remaining seven isolates are found spore formers. As revealed in Table 2, all of the isolates are found smooth in their colonies texture. All of the isolates of colony were transparent (Figure 2).
| Isolates | Colony color | Colony texture | Colony Shape | Cell shape | Appearance | Transparency | Spore formation |
| DU1 | White | Smooth | Circular | Short rode | Raised | Transparent | No spore |
| DU2 | White | Smooth | Circular | Long rode | Slightly raised | Transparent | Spore |
| DU3 | White | Smooth | Circular | Long rode | raised | Transparent | Spore |
| DU4 | White | Smooth | Circular | Short rod | Raised | Transparent | Spore |
| DU5 | Yellow | Smooth | Circular | Short rod | flat | Transparent | No spore |
| DU6 | Pink | Smooth | Circular | filamentous | Raised | Transparent | No spore |
| DE1 | White | Smooth | Circular | Long rod | Slightly raised | Transparent | Spore |
| DE2 | Yellow | Smooth | Circular curly Edge | Short rod | Flat | Transparent | Spore |
| DE3 | White | Fried egg | Circular | Long rode | Flat | Transparent | Spore |
| DE4 | White | Smooth | Circular | Short rode | Raised | Transparent | Spore |
Table 2. Morphological characterization of isolates.

Figure 2. Morphological characterization.
Gram staining and biochemical characterization of bacterial isolates
Gram staining characterization of bacterial isolates: As shown in figure 2 except DU1 and DU5 all isolates were Gram’s positive. The isolates were further characterized by a series of biochemical test as shown in Table 3.
Biochemical characterization showed that all isolates are positive for starch hydrolysis and catalase test. However, they all are negative for indole and oxidase test. Except DU1and DU4, all isolates are urease positive. In motility test all are motile except DU6 and DE3. Based on the biochemical tests result, the isolates were identified as general bacillus and generals pseudomonas (Figures 3,4 and Table 3).

Figure 3. Gram’s staining reaction r.
| S.No | Characteristics | DU1 | DU2 | DU3 | DU4 | DU5 | DU6 | DE1 | DE2 | lDE3 | DE4 | DE5 |
| 1 | Gram reaction | - | + | + | + | - | + | + | + | + | + | + |
| 2 | Citrate test | + | + | - | + | + | + | - | - | + | - | - |
| 3 | Motility | + | + | + | - | + | - | + | + | + | + | - |
| 4 | Urease test | - | + | + | - | + | + | - | + | + | + | + |
| 5 | Glucose peptone agar | + | + | + | + | + | - | + | + | + | + | + |
| 6 | Catalase | + | + | + | + | + | + | + | + | + | + | + |
| 7 | Indole test | - | - | - | - | - | - | - | - | - | - | - |
| 8 | Starchhydrolysis | + | + | + | + | + | + | + | + | + | + | + |
| 9 | Manito fermentation | + | - | + | - | - | - | - | + | + | + | |
| 10 | Oxidase test | - | - | - | - | - | - | - | - | - | - | - |
| 11 | Vogesproskaures test | - | + | + | - | - | - | - | - | - | - | - |
| 12 | Methyl red | - | - | + | + | - | - | + | - | - | - | - |
| 13 | Lactose fermentation | + | - | + | + | + | + | + | + | + | + | + |
| 14 | Sucrose fermentation | + | + | + | + | + | + | + | + | + | + | + |
| 15 | H2S production | - | - | - | - | - | - | - | - | - | - | - |
Table 3. Biochemical characterization of isolates.

Figure 4. Biochemical characterization of isolates.
Phosphate solubilizing capability assay
Determination of the isolates phosphate solubilizing capacity based on PVK culture media pH change.
As shown in Table 4 the pH of the medium was initially neutral (pH=7). However, as the time of incubation increased the pH of the broth media become decreased from the initial pH after inoculating with the isolates.
Based on the observation the pH of the media inoculated with isolate DU2, DE2, DU1, DU3DU4 and DE3 were the lowest after fifteen days of incubation. In addition, the pH of the media inoculated with isolate DU6, DE3 DU5 and DE4, DE1 were next to DU2, DE2, DU3, DU4 and DE3 after fifteen days of incubation. The observed result has been indicated that there was phosphate solubilization due to organic acid secretion.
| Isolates | pH of media before inoculation | pH of bacterial inoculated PVK media after 7 days | pH of inoculated PVK media after 10 days | pH of inoculated PVK media after 15 days |
| DU1 | 7 | 4.69 | 4.5 | 3.85 |
| DU2 | 7 | 4.79 | 3.75 | 3.5 |
| DU3 | 7 | 4.6 | 4 | 3.81 |
| DU4 | 7 | 4.85 | 4.53 | 3.87 |
| DU5 | 7 | 4.9 | 4.5 | 4 |
| DU6 | 7 | 4.8 | 4.5 | 3.92 |
| DE1 | 7 | 4.8 | 4.32 | 4 |
| DE2 | 7 | 5.2 | 5 | 3.72 |
| DE3 | 7 | 4.64 | 4.2 | 3.93 |
| DE4 | 7 | 4.77 | 4.2 | 4 |
| Negative control | 7 | 6.8 | 6.78 | 6.7 |
Table 4. Initial and final pH of PVK liquid medium after 7, 10, 15 days’ inoculation.
Phosphate Solubilization Index (PSI) determination on PVK culture media
Out of the ten phosphate solubilizing bacteria, six from Dupti and four from Deskua, six of the isolates are found to have higher phosphate solubilizing abilities on Pikovskaya’s agar plate, which were selected for further evaluation to enhance plant pot experiment.
All 6 isolates showed clear halo zone around their colonies. The isolates designated as Du1, DU3, DU4, DU5, DE1 and DE2 showed maximum solubilization index in Pikovskaya’s agar media respectively. The isolates were grown on PVK media plates using sterilized cotton swap and the plates were incubated at 28°C for 7 days after that phosphate solubilization index was calculated as shown table 7. DU5, DE1, DE2 have almost similar (6 mm) solubility index. DU3 and DU4 have 4.5 and 5 mm respective solubility index.
Similarly, the isolates formed aclear (halo) zone diameter of between 10 mm and 15 mm and the maximum clear zone diameter of 15 mm was observed in DU5 followed by 14 mm DU3 and 12 mm in DU4 and the least clear zone was obtained in DE1 and DE2 (Figure 5 and Table 5).
| PSB isolates | Hole zone diameter (mean) | Solubility index |
| DU1 | 17 | 5.6 ± 0.21 |
| DU2 | 11 | 3.6 ± 0.13 |
| DU3 | 14 | 4.5 ± 0.12 |
| DU4 | 12 | 5 |
| DU5 | 15 | 6 |
| DU6 | 12 | 3.71 ± 0.19 |
| DE1 | 10 | 6 |
| DE2 | 10 | 6 |
| DE3 | 5 | 2.69 ± 0.07 |
| DE4 | 5 | 2.01 ± 0.10 |
Table 5. Phosphate solubility index mean of isolates.

Figure 5. Show clear zones of isolate.
Spectrophotometric determination of phosphate solubilization ability
The results of insoluble phosphate (Ca3po4)2 solubilization by different isolates are shown in Table 6. All bacterial isolates used in this test are solubilized greater amount of tricalcium phosphate over un-inoculated control. The highest amount of solubilization is recorded by bacterial isolate DE1, DU5, DE2 Du6 and DU1. The result showed that PSB isolates isolated from extreme environment can solubilize insoluble phosphate well.
| Isolates | Solublizationin mg/ml (means ± SD) |
| DU1 | 0.584 ± 0.37 |
| DU2 | 0.25 ± 0.04 |
| DU3 | 0.31 ± 0.11 |
| DU4 | 0.54 ± 0.34 |
| DU5 | 1.01 ± 1.02 |
| DU6 | 0.63 ± 0.84 |
| DE1 | 2.16 ± 1.96 |
| DE2 | 0.907 ± 1.25 |
| DE3 | 0.55 ± 0.27 |
| DE4 | 0.7 ± 0.9 |
| Control with media | 0.025 ± 0.01 |
Table 6. Phosphate solubilization (mg/ml).
Screening bacterial isolates for different stress tolerance
Bacterial growth at different pH: All the isolates were screened for their capacity to grow under wide range of pH. Accordingly, isolates were analyzed using pH ranging from pH-5 to pH-9. As shown in Table 4, seven of the isolates were found to grow in wide range of pH, ranging pH-5 to pH-9. However, isolate DU6 is found to grow near to neutral and slightly alkaline pH (pH-7 and pH-8). Whereas, isolate DE3 and DE4 are observed to grow under acidic and neutral pH, but unable to grow under high saline condition (Table 7).
| Bacteria | pH-5 | pH-6 | pH-7 | pH-8 | pH-9 |
| DU1 | + | + | + | + | + |
| DU2 | + | + | + | + | + |
| DU3 | + | + | + | + | + |
| DU4 | + | + | + | + | + |
| DU5 | + | + | + | + | + |
| DU6 | - | - | + | + | - |
| DE1 | + | + | + | + | + |
| DE2 | + | + | + | + | + |
| DE3 | + | + | + | + | - |
| DE4 | + | + | + | + | - |
Table 7. Bacterial growth at different pH.
Bacterial growth at different salt concentration
All of the isolates were screened for their salt tolerance capacity by growing under different concentration of NaCl on PVK medium. Accordingly, all the isolates were grown on PVK medium containing 5% and 20% of NaCl.
Six of the isolates, four isolates (DU1, DU3, DU4, and DU5) from Dupti kebele sample and 2 isolates (DE1 and DE2) from Deskua kebele sample were found to be able to grow in 15% and 20% NaCl containing media as shown in Table 8.
| Isolates | 5% NaCl | 10% NaCl | 15% NaCl | 20% NaCl |
| DU1 | + | + | + | + |
| DU2 | + | + | + | + |
| DU3 | + | + | + | + |
| DU4 | + | + | + | + |
| DU5 | + | + | - | - |
| DU6 | + | + | + | - |
| DE1 | + | + | + | + |
| DE2 | + | + | + | + |
| DE3 | + | - | - | + |
| DE4 | + | + | + | + |
Table 8. Salt tolerance of isolates.
Bacterial growth at different temperature
To screen mesophilic and thermophiles bacterial isolates, all the isolates were screened for their capacity to resist different temperature ranging from 25°C to 45°C. As a result, all the isolates were able to resist as high as 45°C as revealed in Table 9.
| Isolates | 25°C | 28°C | 37°C | 40°C | 45°C |
| DU1 | + | + | + | + | + |
| DU2 | + | + | + | + | + |
| DU3 | + | + | + | + | + |
| DU4 | + | + | + | + | + |
| DU5 | + | + | + | + | + |
| DU6 | + | + | - | + | + |
| DE1 | + | + | + | + | + |
| DE2 | + | + | + | + | + |
| DE3 | + | + | + | + | + |
| DE4 | + | + | - | + | + |
| DE5 | + | + | + | + | + |
Table 9. Temperature tolerance.
The effect of bacterial isolates inoculation on faba bean growth
The effect of bacterial isolates inoculation on faba beangrowth after 45 days: When the effect of the isolates is compared based on their shoot length of the inoculated faba bean, isolate DU3 was observed to be the most effective to enhance the plant growth as compared with remaining isolates and the negative control as shown in table 10. As statistically revealed (P=0.01), it has been observed that there is significant difference among the isolates to enhance the growth of faba bean with respect to shoot length. Whereas Isolate DE2 is the least effective to promote the growth of faba bean shoot.
As the effect of the isolates are compared based on the leaf number of inoculated faba bean the isolate DU5 (20 ± 1.7) has been the most effective as compared with the remaining isolates and the positive control and negative control. As statistically revealed p=0.024) it has been observed that there is significant difference among the isolates to enhance the growth of faba bean with respect to leaf number. Whereas the isolate DU1 has least effect to promote the growth of leaf number. When comparing the effects of isolates based on node number of inoculated faba bean DU1, DU4, DU5 DE1 DE2 have similar effect with negative control. No significant difference among the isolates to promote the growth of node number of faba bean whereas DU3 has least effect to promote the growth of node number of faba bean with negative control and other isolates.
When the effect of isolates is compared based on their biomass increasing on inoculated faba bean DU3, DU4, DU5, DE1, DE2 isolates are effective to enhance the faba bean plant growth with respect to biomassas compared with negative control. As statistically revealed p=0.48 it has been observed that there is no significance difference among the isolates DU3, DU4, DU5 DE1 and DE2.
Whereas the isolate DU1 has the least effect to promote the growth of faba bean biomass as compared with negative control and the other isolates.
When the effects of isolates compared based on increasing dry mass of inoculated faba bean, isolate DE 1 was observed to be effective to enhance the dry mass of faba bean as compared with other isolates and negative control. Whereas the isolate DE2 is least effective to increase dry mass of faba bean as compared with other isolates but it has similar effect with negative control (Table 10 and Figure 6).
| Treatment | DU1 | DU3 | DU4 | DU5 | DE1 | DE2 | +Ve control | -Ve control | P<0.05 |
| Shoot length (cm) | 44 ± 2 | 55.3 ± 2.08 | 42.67 ± 11.84 | 42 ± 2 | 41.67 ± 2.08 | 39.33 ± 3.05 | 52.33 ± 2.08 | 34 ± 2.64 | 0.01 |
| Root length in (cm) | 9.166 ± 1.04 | 7.5 ± 2.17 | 10.3 ± 1.52 | 7.166 ± 0.288 | 7.166 ± 0.288 | 9.33 ± 4.16 | 11.83 ± 0.288 | 8.5 ± 1.8 | 0.85 |
| Leaf number | 15.66 ± 1.52 | 16.33 ± 0.57 | 18 ± 4.58 | (20 ± 1.7) | 19. ± 3.6 | 17 ± 1 | 17.66 ± 1,52 | 12 ± 10 | 0.024 |
| Node number | 6.66 ± 0.57 | 4.66 ± 0.57 | 6.33 ± 0.577 | 6 ± 0.0 | 6.33 ± 1.15 | 6.33 ± 0.577 | 8 ± 1.0 | 6.33 ± 0.57 | 0.004 |
| Biomass | 4.79 ± 66.8 | 9.733 ± 3.21 | 9 ± 0.64 | 9.2 ± 3.46 | 9.76 ± 3.08 | 9.5 ± 2.4 | 14.33 ± 1,52 | 8 ± 2 | 0.47 |
| Dry mass | 3.16 ± 1.25 | 3.166 ± 1.25 | 3.1 ± 0.38 | 3.166 ± 0.76 | 4.03 ± 1 | 2.96 ± 0.53 | 8..2 ± 1.088 | 2.63 ± 0. | 0.85 |
Table 10. Effect of PSB isolates on different growth parameters in Dosha faba bean under greenhouse condition after 45 days (Mean and STD of faba bean).

Figure 6. Effects of PSB isolates on dosh faba bean.
The effect of bacterial isolates inoculation on faba beangrowth after 60 days
As compared the effect of the isolates based on their shoot length of the inoculated faba bean, the isolate DU5 was observed to be the most effective to enhance the plant growth as compared with remaining isolates and the negative control as shown in table 11. As statistically revealed (P=0.012) it has been observed that there is significant difference among the isolates to enhance the growth of faba bean with respect to shoot length. Whereas the isolate DU3 has the least effect to promote the growth of faba bean shoot length.
When the effect of the isolates is compared based on their root length of the inoculated faba bean, the isolate DU3 was most effective to enhance faba bean growth as compared with the remaining isolates and negative control. As stastically revealed p=0.12 it has been observed that there is no significant difference among the isolates to enhance the growth of faba bean plant with respect to root length.
As compared the effect of the isolates based on leaf number growth of inoculated faba bean, the isolates DU5 and DE2 were observed to be the most effective as compared with the remaining isolates and the positive control and negative control. Stastically revealed p=0.03 it has been observed that there is significance difference among the isolates to enhance the growth of faba bean with respected to leaf number where as DU4 is the least effective to promote the growth of leaf number of faba bean.
When the effect of isolates is compared based on node number of faba bean, the isolates DU1, DU3, DU5 and DE1 were observed to be effective as compared with positive control and negative control. When the effect of isolates is compared based on flower number of faba bean the isolate DU1 and DU5 were effective as compared with the remaining isolates and positive control and negative control. Whereas the isolate DU4 is the least effective as compared with the remaining isolates. When the effect of the isolates is compared based on shoot biomass of the inoculated faba bean the isolate DU1 was observed to be the most effective to enhance faba bean shoot biomass as compared with the remaining isolates and positive control and negative control. Whereas the isolate DU4 has least effect to promote increasing shoot biomass of inoculating faba bean as compare with positive control. As the effects of isolates are compared based on shoot dry mass of inoculated faba bean DU1 is the most effective as compared with the remaining isolates and positive control and negative control. When the effects of isolates are compared based on root biomass of inoculated faba bean DU1 is the most effectiveto increase root biomass of inoculated faba bean as compared with other isolates and positive control and negative control. Whereas DE2 is least effective as compared with the other isolates. When isolates are compared based on root dry mass of inoculated faba bean DU1 was observed to be the most effective as compared with the remaining isolates and positive and negative control with repected to root dry mass of faba bean as stastically revealed p=0.002), it has been observed that there is significant difference among the isolates.with respect to root dry mass of inoculated faba bean (Table 11).
| Treatment with isolates | |||||||||
| Parameter | DU1 | DU3 | DU4 | DU5 | DE1 | DE2 | +Ve control | -ve control | P 0.05 |
| Shoot length (cm) | 58 ± 10.58 | 48 ± 6.24 | 50.33 ± 0.57 | 71.66 ± 15.27 | 54.66 ± 5.03 | 54.3 ± 3.5 | 50 ± 1 | 44 ± 3.6 | 0.012 |
| Root length (cm) | 12 ± 1 | 13.33 ± 1.52 | 9 ± 1 | 12.66 ± 3.78 | 11.33 ± 2.51 | 10.66 ± 1.5 | 12.66 ± 1.5 | 8.66 ± 0.577 | 0.126 |
| Leaf numberr | 31.33 ± 3.78 | 33 ± 1 | 30.3 ± 2.51 | 39 ± 4.35 | 38 ± 2 | 39.33 | 36.33 ± 2.54 | 34 ± 2 | 0.03 |
| Node number | 13.3 ± 0.57 | 13.3 ± 2.08 | 11.66 ± 1.15 | 13.3 ± 0.57 | 13 ± 1 | 12.6 ± 0.57 | 12.3 ± 0.57 | 11 ± 1 | 0.117 |
| Flower number | 7.3 ± 2.3 | 6 ± 1 | 4.6 ± 1.52 | 7 ± 0 .00 | 5.3 ± 0.57 | 6 ± 1 | 4.66 ± 0.57 | 4.66 ± 0.57 | 0.059 |
| Shoot biomass | 28.7 ± 8.86 | 17.9 ± 10.32 | 15.1 ± 6.2 | 21 ± 6.4 | 18.8 ± 4.8 | 17.7 ± 5.08 | 20.1 ± 5.12 | 14 ± 6.9 | 0.363 |
| Shoot drymass | 3.1467 ± 1.1 | 2.1 ± 1.4 | 1.63 ± 0.57 | 2.48 ± 1.03 | 1.8567 ± 0.34 | 1.96 ± 0.16 | 2.9 ± 0.5 | 1.3433 ± 1 | 0.26 |
| Root biomass | 7.7 ± 1.13 | 4.6 ± 3.04 | 5.08 ± 1.92 | 4.2 ± 1.5 | 4.1± 2.42 | 3.8 ± 063 | 6.7 ± 2.17 | 2.2 ± 0.9 | 0.057 |
| Root dry mass | 0.903 ± 0.13 | 0.46 ± 0.26 | 0.88 ± 0.09 | 0.53 ± 0.21 | 0.42 ± 0.202 | 0.39 ± 0.94 | 0.57 ± 0.19 | 0.19 ± 0.09 | 0.002 |
Table 11. Effect of PSB isolates on different growth parameters in Dosha faba bean under greenhouse condition after 60 day.
The correlation of Dosha faba bean after 60 day
As shown the table below the pearson correlation of dosha faba bean in similar parameter such as shoot length with shoot length have strong positive correlation. Node number with, shoot length (0.417)*, and pode number with root length (0.510*) have moderately correlated. Flower number with shoot length (0.575**) and flower number with node number 0.592** have strongly correlated. However, shoot drymass is negatively correlated with leaf and node number the pot inoculated with these PSB isolates had considerable effect on shoot length, root length, leaf number node number flower number shoot biomass and shoot dry mass, root biomass, root dry mass of Dosha faba bean (Table 12).
| Shoot length | Root length | Leaf NO- | -Nodeno | Flower no | Shoot biomass | Shoot drymass | Root biomas | Root dry mass | |
| Shoot length (cm) | 1 | ||||||||
| Root length (cm) | 0.54 | 1 | |||||||
| Leaf number | 0.203 | 0.271 | 1 | ||||||
| Node number | 0.417* | 0.510* | 0.176 | 1 | |||||
| Flower the pearson corilation number | 0.575** | 0.202 | 0.079 | 0.592** | 1 | ||||
| Shoot biomass | 0.373 | 0.082 | 0.163 | 0.239 | 0.493* | 1 | |||
| Shoot dry mass | 0.044 | 0.348 | -0.08 | -0.124 | 0.103 | 0.339 | 1 | ||
| Root biomass | 0.053 | 0.44 | 0.127 | 0.447* | 0.095 | 0.460* | 0.264 | 1 | |
| Root dry mass | 0.111 | 0.207 | -0.31 | 0.329 | 0.163 | 0.241 | 0.127 | 0.578** | 1 |
| *Correlation is significant at the 0.05 level (2- tailed) **Correlation is significant at the 0.01 level (2- taild) Node number with, shoot length (0.417), and pode number with root length (0.510*) have moderately correlated Flower number with shoot length (0.575**) and flower number with node number have strongly correlated |
|||||||||
Table 12. Pearson correlation for Dosha faba bean after 60 day.
The effect of bacterial isolates inoculation on Eliodoro wheat variety growth
The effect of bacterial isolates inoculation on Eliodoro Wheat variety growth after 45 days: When the effect of the isolates is compared based on their shoot length of the inoculated eliodoro wheat variety, isolate DU1 was observed to be the most effective to enhance the plant growth as compared with the remaining isolates and the negative control. As statistically revealed (P=0.019), it has been observed that there is significant difference among the isolates to enhance the growth of wheat variety with respect to shoot length. Whereas DE1 is the least effective as compared with other isolates and negative control. As compared the effect of isolates based on root length of the inoculated wheat variety the isolate DU5 is effective However as statically revealed p=0.09. It has been observed that there is no significant difference among the isolates and negative and positive control with respected to root length. When comparing the effect of isolates based on leaf number of inoculated wheat and as revealed p=0.077 it has been observed that there is no significant difference among the isolates and negative control with respect to leaf number of wheat.
Effects of isolates are compared based on biomass of inoculated wheat and all isolates have similar effect. As statically revealed p=0.139 it has been observed that there is no significance difference among the isolates, negative and positive control. As compared effects of isolates based on dry mass of inoculated wheat stastically revealed p=0.73 there is no significance difference observed among the isolates and negative controls (Tables 13,14).
| Parameter | Treatment with isolates | P-value | |||||||
| DU1 | DU3 | DU4 | DU5 | DE1 | DE2 | DAP | CONTROL | ||
| Shoot length in cm | 30.3 ± 1.52 | 25 ± 5.5 | 28.6 ± 1.52 | 29.6 ± 2.5 | 22.33 ± 2.08 | 26.33 ± 2.08 | 30 ± 1 | 27.3 ± 1.52 | 0.019 |
| Root length | 10.3 ± 2.08 | 10.83 ± 1.6 | 12.8 ± 2 | 12.6 ± 1.5 | 11.5 ± 0.5 | 10.5 ± 0.5 | 8.5 ± 2.1 | 11.8 ± 1.8 | 0.09 |
| Leaf number | 5.66 ± 0.57 | 5 ± 1 | 5 ± 1 | 5 ± 1 | 5 ± 1 | 4.33 ± 0.57 | 5 ± 1 | 4.6 ± 0.57 | 0.77 |
| Biomass | 5.03 ± 0.86 | 4.37 ± 1.8 | 5.47 ± 1.5 | 4.6 ± 0.7 | 3 ± 0.98 | 3.5 ± 0.3 | 2.9 ± 0.44 | 4.5 ± 1.6 | 0.139 |
| Dry mass | 0.86 ± 0.15 | 0.79 ± 0.32 | 0.79 ± 0.21 | 0.79 ± 0.13 | 0.54 ± 0.201 | 0.84 ± 0.28 | 0.75 ± 0.13 | 0.68 ± 0.15 | 0.73 |
Table 13. Effect of PSB isolates on different growth parameters in Alidoro Wheat variety under greenhouse condition after 45 day.
Correlation of wheat after 45-day inoculation
| Shoot length | Root length | leaf number | biomass | dry mass | |
| Shoot length | 1 | ||||
| Root lenth | -0.071 | 1 | |||
| Leaf number | -0.04 | 0.073 | 1 | ||
| Biomass | 0.293 | 0.358 | 0.205 | 1 | |
| Drymass | 0.212 | -0.152 | -0.34 | 0.255 | 1 |
Table 14. Pearson correlation after 45 day of wheat.
The effect of bacterial isolates inoculation on Elioidoro Wheat variety growth after 60 days
When the effect of the isolates is compared based on their shoot length of the inoculated Eliodoro wheat variety, isolate DU5 was observed to be the most effective to enhance the plant growth as compared with remaining isolates and the negative control as shown in table 14. As the effect of isolates compared based on root length of inoculated wheat variety. DU5 is also most effective as compared with the remaining isolates. As stastically revealed p=0.02 it has been observed that there is significant difference among the is isolates with negative control and positive control. With respect to root length whereas the isolate DU3 and DE1 were the least effective as compared with other isolates with respect to root length. As compared the effect of isolates based on leaf number of the inoculated wheat variety stastically revealed p=0.9 it has been observed that there is no significant difference among the isolates and negative controls. When the effect of the isolates is compared based on their biomass and drymass of the inoculated wheat variety stastically revealed p=0.06 and 0.063 these have been observed that there is no significant difference among the isolates and the control group with respect to biomass and dry mass of inoculated wheat variety (Table 15).
| Parameter | DU1 | DU3 | DU4 | DU5 | DE1 | DE2 | +ve control | -ve control | P-value |
| Shoot length in (cm) | 66 ± 5.2 | 61.6 ± 3.21 | 66.3 ± 9.07 | 71.66 ± 2.5 | 68 ± 2 | 69.6 ± 0.57 | 68.3 ± 4.7 | 58.6 ± 8.09 | 0.121 |
| Root length (cm) | 8 ± 1.3 | 6.1 ± 1.04 | 7 ± 2.64 | 9.5 ± 1.8 | 6.1 ± 0.28 | 8.83 ± 0.28 | 9.6 ± 1.52 | 5.6 ± 1.52 | 0.02 |
| Leaf number | 6.3 ± 0.53 | 6 ± 1 | 5.6 ± 0.57 | 6 ± 1 | 6 ± 1 | 6 ± 1 | 6.3 ± 0.57 | 5.3 ± 0.57 | 0.9 |
| Biomass (g) | 5.7 ± 1.3 | 4.43 ± 1.24 | 5.13 ± 1 | 6.4 ± 1.34 | 3.9 ± 0.85 | 6.13 ± 1.03 | 5.3 ± 0.7 | 5 ± 1.21 | 0.06 |
| Drymasin (g) | 2.24 ± 0.6 | 1.98 ± 0.2 | 1.73 ± 0.3 | 2.27 ± 0.11 | 1.39 ± 0.17 | 1.65 ± 0.38 | 1.67 ± 0.57 | 1.4 ± 0.19 | 0.063 |
Table 15. effects of PSB isolates on different growth parameter in eliodoro wheat variety after 60 days under greenhouse condition (Values re given as means ± SD for triplicate samples).
The correlation on effects of isolates on wheat growth after 60 day
As shown the table below the effects of isolates based on the correlation of root length with shoot length=(0.430*) have moderately correlated with each other. Whereas biomass with root length has negative correlation. The effect of isolates based on biomass with leaf number also has negatively correlated whereas dry mass with node number have positive correlation (Table 16).
| Shoot length | Root length | Leaf number | Biomass | Drymas | |
| Shoot length | 1 | ||||
| Root length | 0.430* | 1 | |||
| Leaf number | 0.161 | 0.046 | 1 | ||
| Biomass | -0.021 | 0.268 | -0.025 | 1 | |
| Drymas | 0.123 | 0.276 | 0.027 | 0.473* | 1 |
| *Correlation is significant at the 0.05 level (2-tailed). | |||||
Table 16. Pearson correlation on effects of isolates on wheat growth after 60 days.
As shown the table above root length and shoot length have medium correlation and they are significant at 0.05 level. In addition to this root length and shoot length, biomass and dry mass also have medium correlation (0.473*) (Figure 7).

Figure 7. Effects of psb on eliodo wheat variety.
As stated in the objective, the aim of this study was to isolate, and characterize phosphate solubilizing bacteria from soil sample collected Dupti Kebele of Afar region and Deskua kebele of Amhara regional state in south Gondar Zone. Soil physico-chemical analysis revealed that, soil samples from study sites had significantly different pH, electrical conductivity, cation exchange capacity, organic matter and macro-elements (phosphorus, calcium, magnesium and potassium and nitrogen). From this total of 10 phosphate solubilizing bacteria isolates were isolated from the two study sites, which have distinct ecologies.
Morphological characterization, gram reaction and biochemical test result showed that all isolates are gram positive, white circular shaped, transparent except DU1 and DU5 which these are gram negative, white and yellow, circular shaped bacterial isolates. As morphological characterization, gram reaction, biochemical test result revealed DU2, DU3, DU4, DU6, DE1, DE2 DE3, DE4 were gram positive, white, smooth, circular, rode, transparent and spore former. When these isolates are characterized biochemically they all are positive for catalase test and starch hydrolysis test. However, they all are negative for indole test and oxidase test. Except DU3, DU4, and DE1 all these gram positive bacteria were negative for methyl red test. Based on these observed result and characterstics these gram positive bacteria have possibility to be general bacillus. Whereas DU1 and DU5 isolates are gram negative smooth and short rod. As biochemical characters’ tics revealed both of these gram negative bacteria were positive for citrate, motility, glucose, catalase starch, hydrolysis, sucrose and lactose fermentation tests. However, they are negative for indole test, methyl red test, Voges Proskauers test based on these characterizations these two bacterial isolates have the possibility to be general pseudomonas. This finding is supported by Sun dram who they reported that most efficient and frequently encountered phosphate solubilizing bacteria belonging to the genus Pseudomonas or the genus Bacillus.
All these isolates are grown in acidic medium to alkaline medium between pH6 to pH9 except DE3, DE4 and DU6 which these were grow in pH6, pH7 and pH8. All isolates were grown on PVK medium containing 5% and 10% of NaCl. However, only 6 isolates, 4 isolates (DU1, DU3, DU4, and Du5) from Dupti kebele soil sample, 2 isolates (DE1 and DE2) from deskua kebele soil sample were effectively grown in 15% and 20% of NaCl. Therefore, these isolates can survive at high concentrations of NaCl (up to 20%). Ineeded this result is in line with the previous findings which they reported that.
These isolates were also formed clear zones by solubilizing suspended TCP due to the release of organic acids into the surrounding medium. The isolate PSB DU5 (6 mm), DE1 (6 mm), DE2 (6 mm) showed maximum solubilization index, followed by PSB DU1 (5.6 mm, DU4 (5 mm), DU3 (4.5) as shown in Table7 this finding is in line with Gaur which he reported that when PSB microorganisms grown in calcuim triphosphate containing medium produce hole zone around their colonies through the production of organic acid. All isolates were confirmed for their Phosphate solubilization ability by pvk broth medium for quantitative determination of available phosphorous. This indicated that the isolates PSB DE1, DU5 and DE2 solubilized significantly higher phosphate than all other bacterial isolates. An inverse relationship was also observed between pH value of culture medium and phosphate solubilization due to organic acid secretion. As shown in table 9 the pH of the medium was initially neutral (pH=7). However, as the time of incubation increased the pH of pvk broth media become decreased from initial pH after inoculating with the isolates. Based on the observation the pH of the media inoculated with isolate DU2=3.5, DE2=3.72 DU1=3.8, DU3=3.8, DU4=3.87 and DE3=3.9 DU5=4, DE1=4 were recorded after fifteen days of incubation. Therefore, the PH of all bacterial inoculated PVK medium decrease their pH from pH 7 to PH3.5, pH3.8 and pH3.9 PH4 were recorded. This observed result, is agree with Rodr guez and Fraga which they stated that phosphate solubilizing microorganisms formed clear zones by solubilizing suspended TCP due to the release of organic acids into the surrounding medium. This leads to increased P availability, which ultimately increases plant P uptake.
In the present study, 10 PSB strains were isolated and six of these were efficient PSB isolates (DU1, DU3, DU4, DU5, DE1 and DE2 solubilized inorganic phosphate with solubilization index ranged from 4.5 to 6. They were selected for further studies for pot experiment of Dosha faba bean and Alidoro wheat variety. Present study was conducted to screen the potential Phosphate solubilization and their use as a biofertilizer. DU1, DU3, DU4, DU5, DE1 and DE2 were selected for pot scale trial because of their positive, their efficient phosphate solubilization ability on plate assay as well as their release of free P in liquid culture medium and their abilities to enhance plant growth.
This study showed the isolated PSB had considerable effect on agronomic property such as plant height, number of leave, number of node, number of flower, biomass of shoot, dry mass of shoot, biomass of root, dry mass of root. Isolate PSB DU5 showed the best effect on shoot length (71.66 ± 15.27), root length (12.66 ± 3.7), leaf number (39 ± 4.35), nod number (13.3 ± 0.57) Isolate PSB DU1 and PSB DE1, DE2 showed second and third best effect on shoot length of Dosha faba bean growth respectively. Similarly, PSB DU3 significantly increased root length (13.33 ± 1.52) of faba bean. DU1, DU3, DU5 and DE1 had similar effect on pod number of faba bean. All PSB isolates significantly increased the shoot length and fresh shoot biomass, root length root biomass of faba bean as compared with positive control and negative control of faba bean pot experiment. This result is agreeing. Which they reported that the increase in shoot length, root length, leaf number, shoot dry weight, and root dry weight of bean plants inoculated with PSB strains could be attributed to a greater absorption of nutrients, especially Phosphorus uptake. The result of analyses of variances showed that most of these PSB isolates significantly (p ≤ 0.05) increase all the investigated parameters such as plant height, fresh/wet weight (biomass), dry weight, number of leave, flowering as compared with positive and negative control. The correlation analysis reveal that plant shoot length and plant root length were found to be positively correlated with number of leave and strongly correlated with number of node. Other studies showed that plant height and shoot (number of leave) are usually positively correlated.
In the present study ten phosphate solubilizing bacterial isolates coded as DU1, DU2, DU3, DU4, DU5, DU6, DE1, DE2, DE3, DE4 were isolated and biochemically characterized. All isolates were found to be efficient in solubilization of tricalcuim phosphate. However only six isolates were used for pot experiment due to maximum phosphate solubilization and stress tolerance ability.
Author did not declare any conflict of interest.
The author is grateful to University of Gondar for providing financial support for the project.